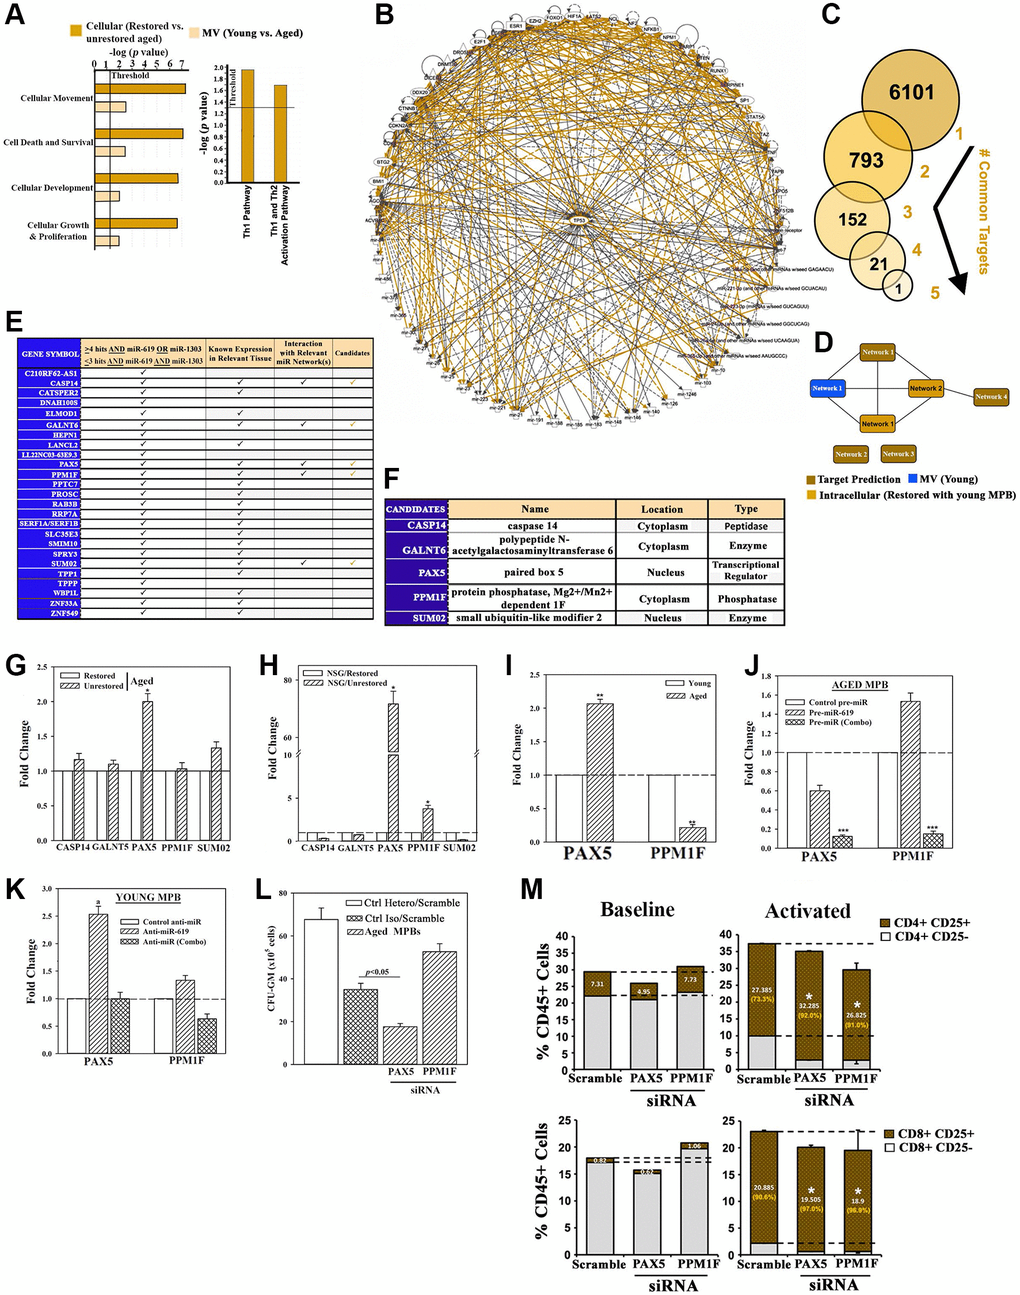
Figure 4.Exosomal miRNA targets in restoration. (A) IPA output of top predicted cellular functions (left) and canonical pathways (right) in analyses of MV miRNAs from the following: young vs. aged cells, heterochronic vs. aged isochronic cultures. (B) Radial depiction of young MV vs. restored intracellular interactome with p53 at the center of overlapping networks (Orange, direct interactions). (C) Analyses of 6 miRNAs (Figure 4L) for targets using TargetScan human database. (D) Targets were analyzed by IPA and the predicted networks (brown) compared to the young exosomal (blue) and aged heterochronic intracellular (dark orange) miRNA interactome. (E) Tabulation of selected targets and predicted interaction with the miRNA interactome. (F) 5 potential downstream targets for functional validation. (G, H) qPCR for candidate targets using RNA from aged cells of heterochronic or isochronic cultures (G), or human cells from femurs of huNSG (H), Fold change of normalized (β-actin) results, n = 4. (I) qPCR for PAX5 and PPM1F in aged and young MPBs, fold change with young donor assigned 1. (J, K) Aged MPBs were transfected with pre-miRs or control miR (J) and young MPBs, with anti-miRs or control miR (K). At day 7, the cells were analyzed for PAX5 and PPM1F mRNA by qPCR. The data are presented as the mean ± SD fold change, n = 4. The controls were assigned values of 1. (L) Aged MPBs were transfected with PAX5 or PPM1F siRNA or scramble (control). At day 7, the cells were analyzed for CFU-GM. Positive ctrl: heterochronic cultures, mean CFU-GM ± SD, n = 4. (M) Effect of PAX5 or PPM1F knockdown by siRNA on T-cell activation (CD25) for CD4+ (top panels) and CD8+ (bottom panels) populations. Right panels represent the % activated vs. total T-cells shown in orange. See also Supplementary Figure 4.
Figure 4 — Restoration of aged hematopoietic cells by their young counterparts through instructive microvesicles release | Aging