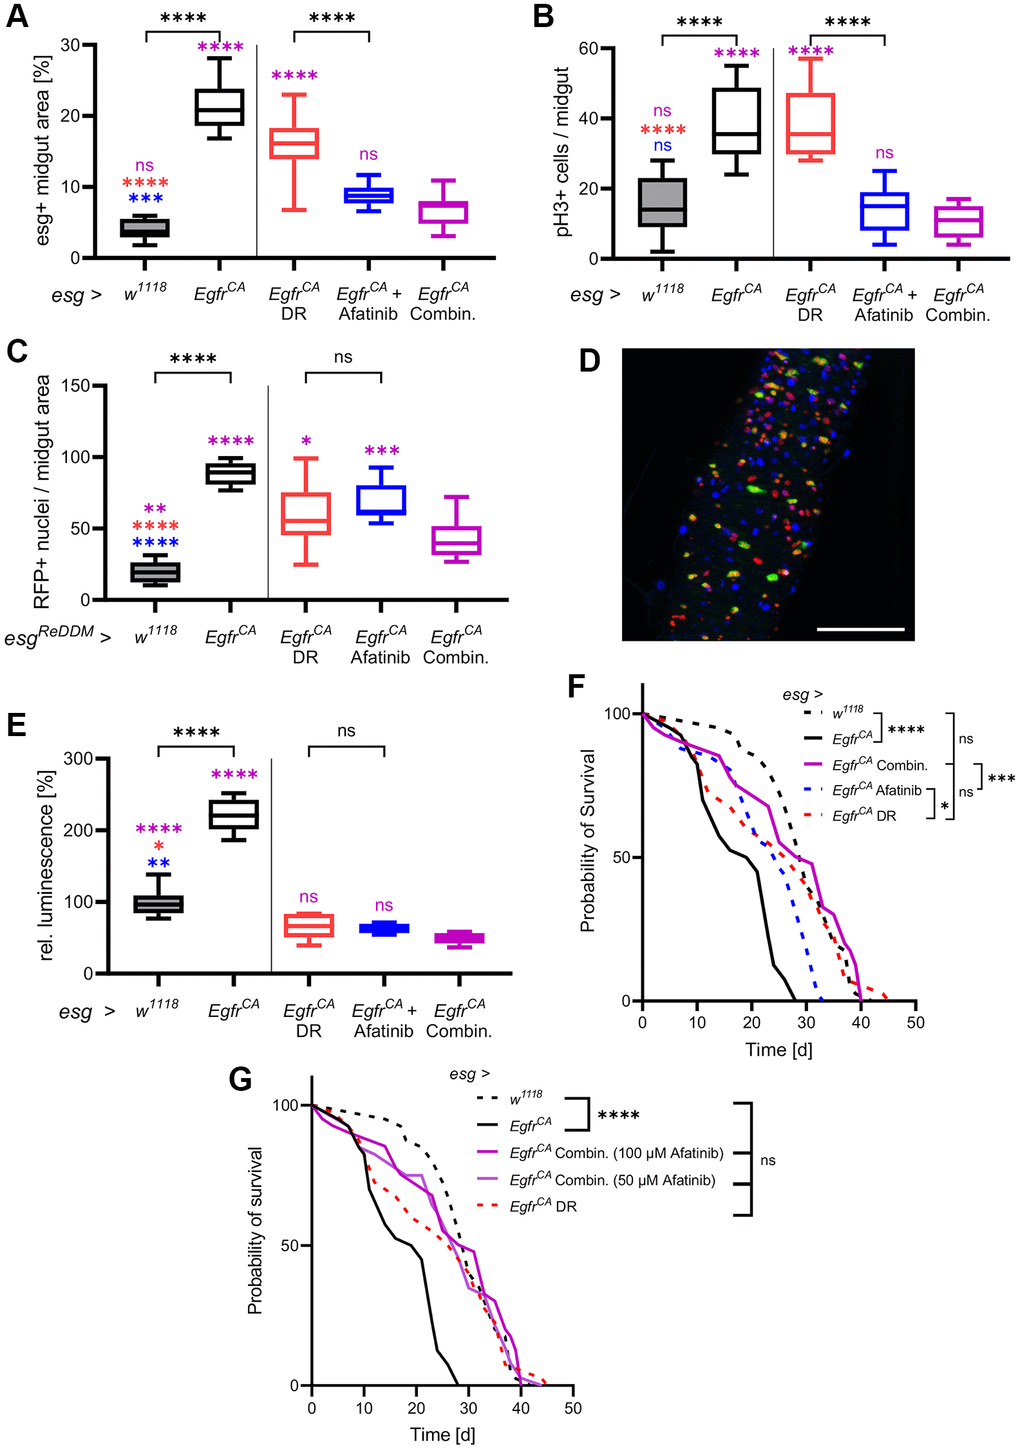
Figure 4.DR combined with afatinib reduces cell proliferation and restores lifespan. Control animals (esg > w1118) and animals with Egfr-induced over-proliferation (esg > EgfrCA) in intestinal stem cells and enteroblasts (esg+ cells) were exposed to a combination of DR and afatinib at induction (shown in magenta). Data were compared to animals that were exposed to dietary restriction (DR, red) or treated with afatinib (blue, 100 μM). (A) Quantification of the area covered by GFP-positive cells indicating the number and size of esg+ cells in the midgut after 5 days of induction. n = 10–13. (B) Midguts were stained with an antibody for phospho-histone 3 to mark cells undergoing mitosis after 5 days of induction. Positively stained cells in the whole midgut were counted. n = 9–11. (C) Quantification of cells that are RFP-positive after 5 days of induction of the ReDDM system. n = 10–11. (D) The combination of both treatments was analysed using the ReDDM system. Esg+ cells are shown in green, RFP-positive progeny are shown in red, and nuclei are shown with blue DAPI staining. (E) Luciferase and GFP were expressed simultaneously and luciferase activity was quantified in whole animals after 15 days of induction. n = 5–7. (F) The lifespan of animals exposed to DR, afatinib, or a combination of DR and 100 μM afatinib. n = 32–40. (G) The lifespan of animals exposed to DR in combination with either 100 μM or 50 μM afatinib. n = 32–40. Statistical significance was tested by one-way ANOVA and the Tukey test. Lifespan significance was tested by the log-rank (Mantel-Cox) test. Significances are marked with lines or corresponding color. ns = not significant, * = p < 0.05, ** = p < 0.01, *** = p < 0.001, **** = p < 0.0001. Scale bar: 100 μm.