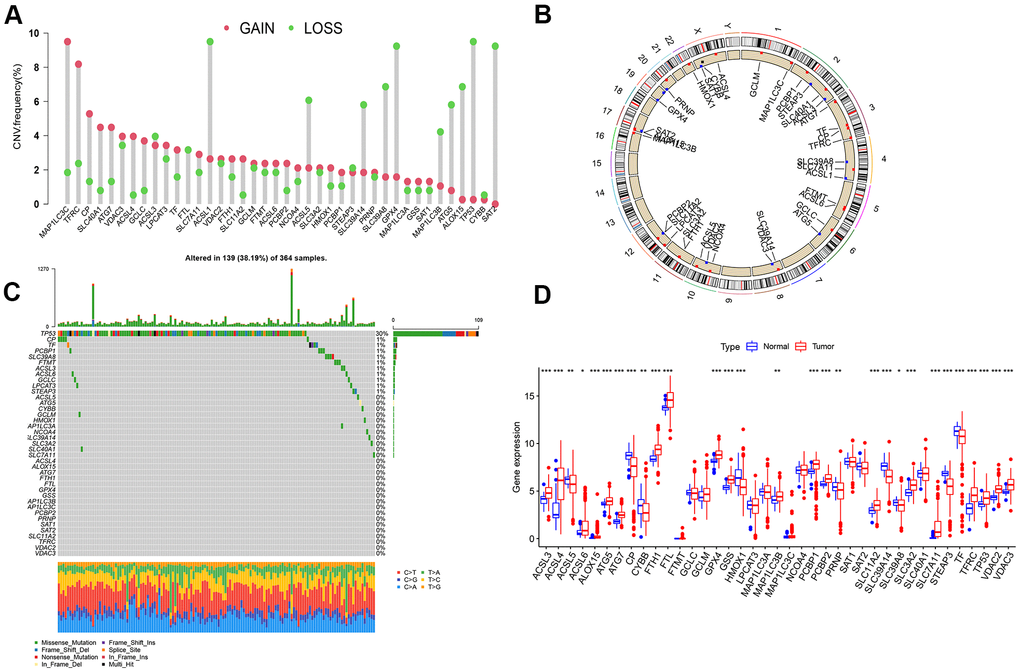
Figure 1.Analysis on ferroptosis genes variation and its expression in LIHC. (A) Frequency of copy number change of 40 ferroptosis genes in LIHC; the height of the column represents the frequency of change; the green dots represent the frequency of deletions; red dots represent copy number increase frequency. (B) 23 pairs of human chromosomal ferroptosis gene copy number change position. Red dot represents that the sample with the increased copy number was larger than that with the deletion copy number, while blue dot represents the opposite. (C) Somatic cell mutation of ferroptosis genes in 364 LIHC samples was detected, and 139 (38.19%) had mutations. The maximal mutation frequency was TP53. The upper bar graph presents TMB, and the number on the right represents the mutation frequency of the respective regulator. The bar graph on the right illustrates the proportion of the respective mutation type, and the bar graph below represents mutation transformation. (D) Expression of Ferroptosis genes in normal and LIHC samples (***P < 0.001, **P < 0.01, *P < 0.05).