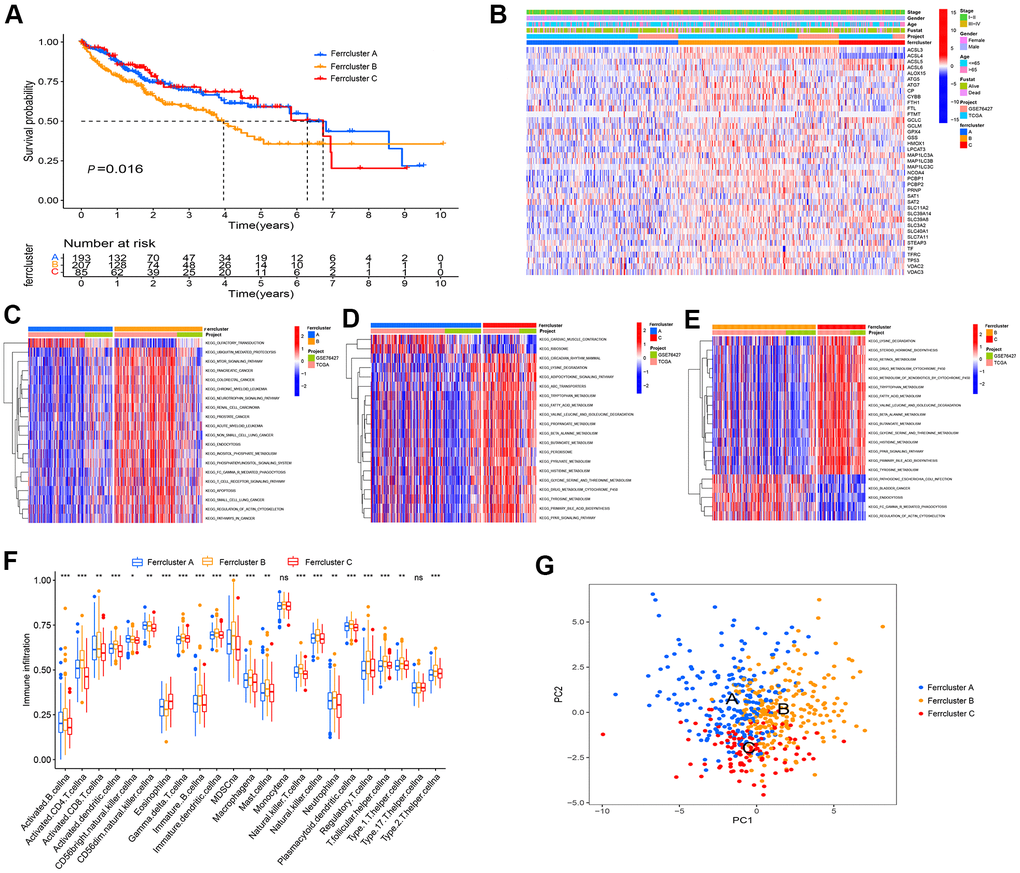
Figure 2.Ferroptosis genes subtype, pathway enrichment analysis and TME infiltration. (A) GEO and TCGA cohort were combined, and unsupervised cluster analysis was conducted on 538 LIHC samples, i.e., 213 cases with Ferrcluster A, 222 cases with Ferrcluster B and 103 cases with Ferrcluster C. Kaplan-Meier curve showed statistically significant difference in the survival among the three types (P=0. 016). (B) Thermogram results showed the expressions of different clinical traits in the three types. (C–E) The GSVA enrichment analysis reported the activation of pathways among different subtypes. The heat maps illustrate the mentioned biological processes; red represents the activation pathway, and blue represents the inhibitory pathway; (C) Ferrcluster A vs. Ferrcluster B; (D) Ferrcluster A vs. Ferrcluster C; (E) Ferrcluster C vs. Ferrcluster B. (F) The infiltration of immune cells in TME in 3 subtypes, the upper and lower ends of the box indicate the quartile range of the value. The lines in the box denote the median value (***P < 0.001, **P < 0.01, *P < 0.05). (G) Principal component analysis indicated significant differences in the three types.