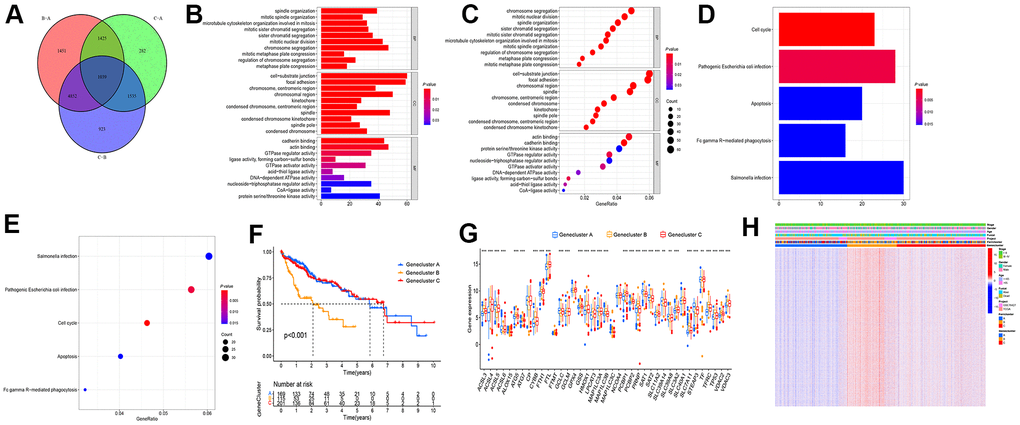
Figure 3.Screening differential gene among the subtypes of differential genes. (A) Wayne diagram was adopted to screen the difference genes in the three types, and 1039 genes were obtained after taking the intersection. (B–E) GO and KEGG enrichment analysis were performed on the intersection gene. (F) Cluster analysis was conducted on the intersection gene, and the patients fell to ferroptosis Genecluster A-C, with Genecluster A, B, and C as 169, 115, and 201 patients, respectively. (G) Expressions of ferroptosis genes in three gene clusters. (H) Thermogram showed the expression of clinical features among the three gene clusters. (***P < 0.001, **P < 0.01, *P < 0.05).