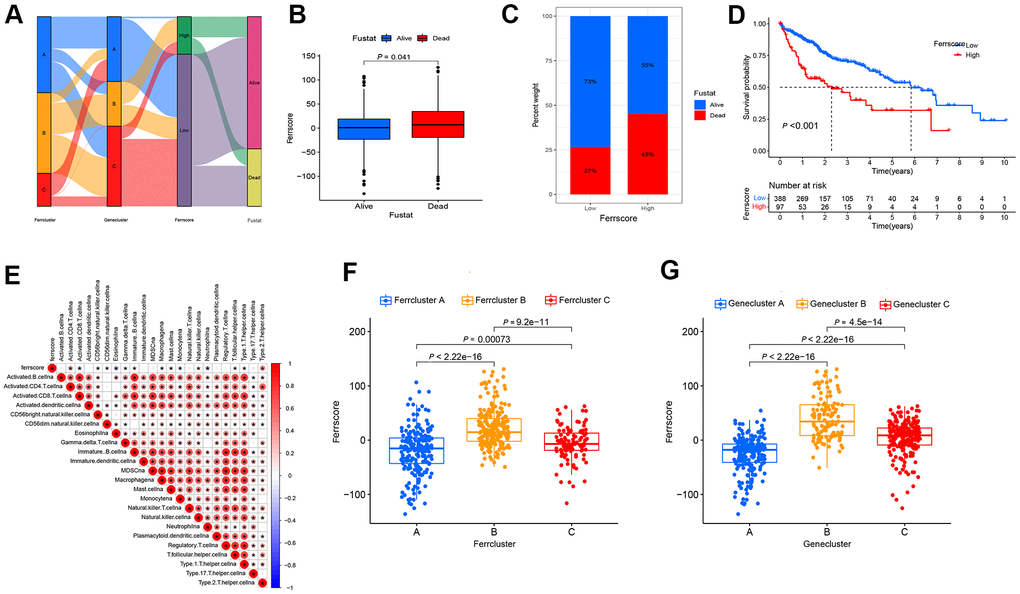
Figure 4.The built ferroptosis scoring model. (A) Sanky diagram is used to show the attribute changes of individual liver cancer patients, showing the relationship between ferrcluster, genecluster, ferrscore and survival status. (B) Box chart shows ferrscore of dead and surviving patients, and the difference showed statistical significance (P < 0.05). (C) The survival status of patients in the high and low ferrscore groups, red represents death and blue represents survival. (D) Kaplan-Meier curve was used to analyze the survival of patients with high and low ferrscore liver cancer (P < 0.001). (E) The Spearman correlation analysis was conducted to examine the relationship between ferrscore and immune infiltrating cells. (F) The Kruskal-Wallis test was carried out to compare the statistical differences in the three types of Ferrcluster A-C (P < 0.001). (G) The Kruskal-Wallis test was performed to compare the statistical differences among the three gene subtype ferroptosis Genecluster A to C (P < 0.001).