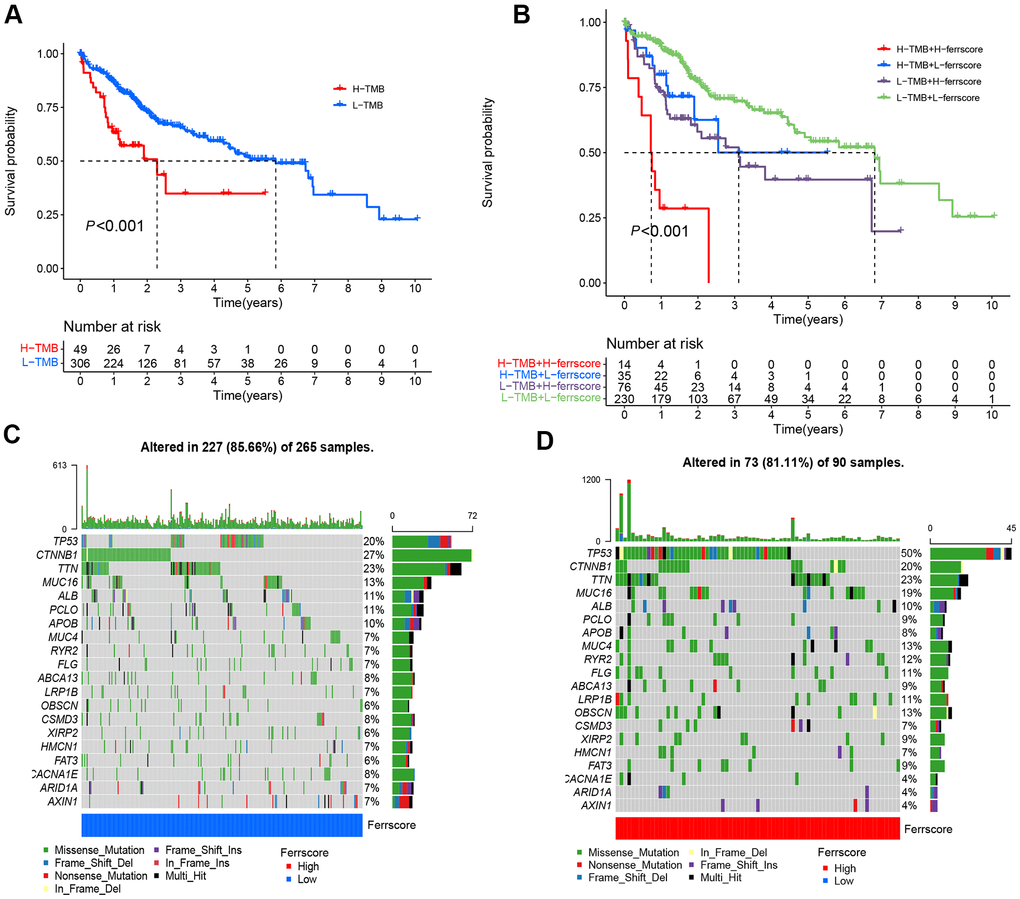
Figure 5.Ferroptosis score and tumor mutation analysis. (A) The Kaplan-Meier curve was adopted to analyze the survival of patients with liver cancer in the high and low ferrscore groups (P < 0.001). (B) The survival analysis of patients stratified with the ferrscore and the TMB by using the Kaplan-Meier curve (H=high; L=Low). A cascade chart of tumor somatic mutation established by patients with low ferrcore (C) and high ferrscore (D). Each column represents an individual patient. The bar chart above shows the TMB, and the number on the right represents the mutation frequency of the respective gene. The bar chart on the right presents the proportion of each mutation type.