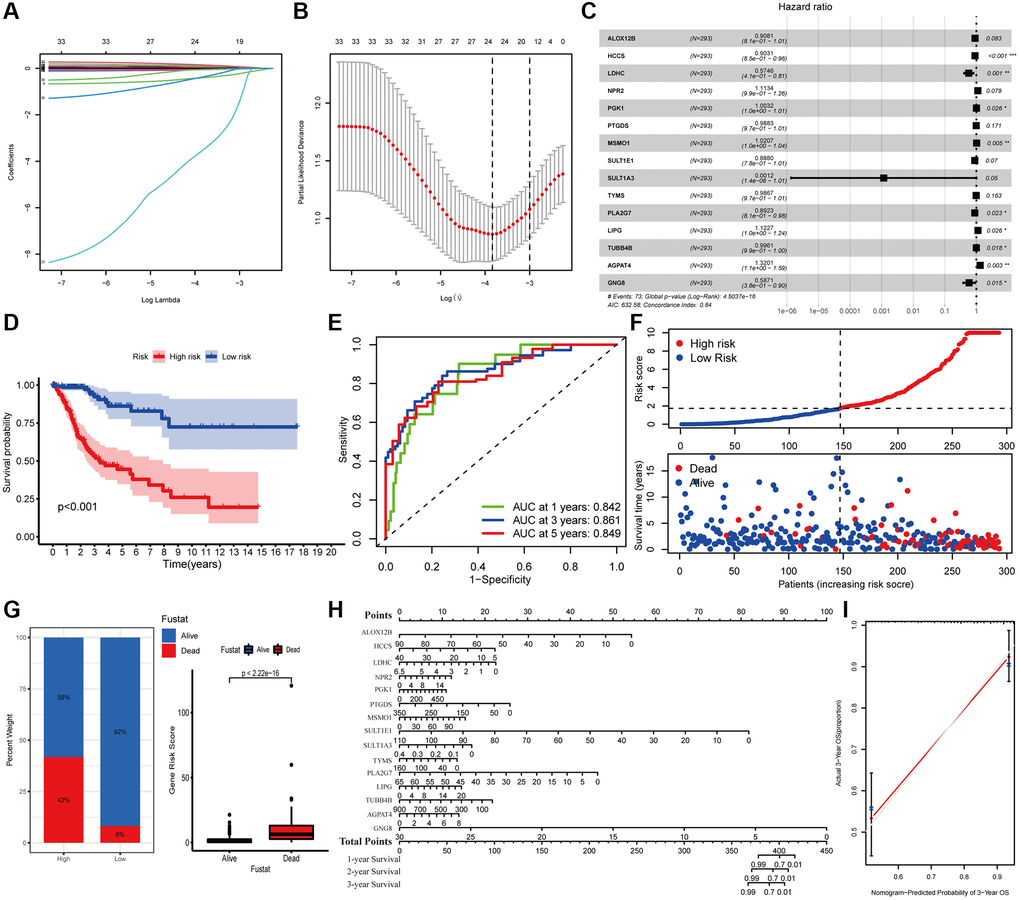
Figure 2.Construction of metabolic gene-associated prognostic model (MGPM) using a series of bioinformatics technology. (A, B) LASSO Cox regression analysis with 5-fold cross-validation and generation of coefficient outline based on the log (lambda) sequence were used to identify the potential independent prognostic risk signature genes. (C) Multivariate Cox regression analysis results show the p values and hazard ratios (HR) with confidence intervals (CI) of the fifteen DEMGs. (D) Kaplan-Meier survival curves show the overall survival (OS) rates of high-risk (n = 146) and low-risk (n = 147) CC patients. Patients in high-risk group had a shorter OS compared to those in low-risk group. (E) ROC curve analysis results show the accuracy and reliability of the MGPM in determining the 1-, 3- and 5-year survival outcomes (AUC values are shown in parentheses). (F) From the top to bottom, the survival status of each patient was sorted according to the low-risk (blue) and high-risk (red) scores. A scatter plot then exhibited the survival status and survival time of patients, the dots represent patients that have died (red) and alive (blue) at the time of analysis. (G) Analysis of the difference in survival status between the low- and high-risk groups. (H, I) The nomogram and calibration plot were employed to depict the expected survival of individual CC patients and to assess the discriminative ability of the MGPM-based risk signature, respectively.