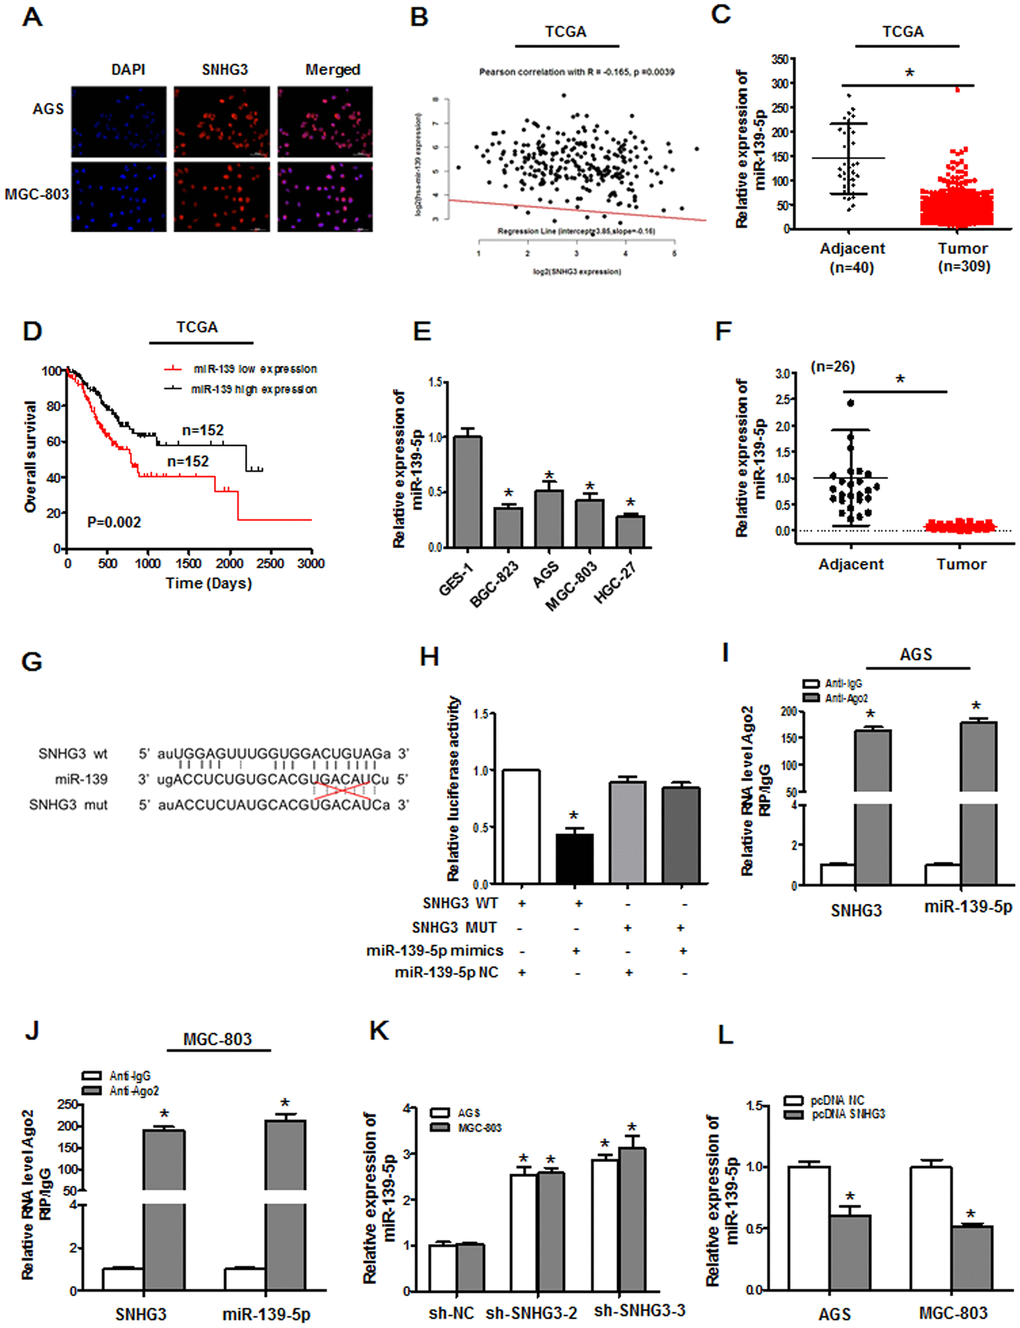
Figure 4.SNHG3 directly targets miR-139-5p in gastric cancer. (A) The localization of SNHG3 was assessed via an RNA FISH assay in AGS and MGC-803 cells. (B) Correlations between the expression of miR-139-5p and SNHG3 in TCGA database samples were assessed via Pearson’s correlation analyses, R=-0.165, P=0.0039. (C) miR-139-5p expression levels in gastric cancer tissues from the TCGA database, *P<0.01. (D) The overall survival of gastric cancer patients in the TCGA database was compared as a function of miR-139-5p expression levels (high vs. low; log-rank, P=0.002). (E) qPCR was used to measure miR-139-5p expression in GES-1, BGC-823, AGS, MGC-803, and HGC-27 cells. *P<0.01 vs. GES-1 cells (F) qPCR was used to assess miR-139-5p expression in 26 pairs of gastric cancer tumor and paracancerous tissues, *P<0.01. (G) Predicted sequence complementarity between miR-139-5p and SNHG3. (H) SNHG3 and miR-139-5p binding in 293T cells was assess via luciferase reporter assay following co-transfection with SNHG3 WT or SNHG3 MUT and miR-NC or miR-139-5p mimics. *P<0.01 vs. control. (I, J) Interactions between miR-139-5p and SNHG3 were assessed via RIP assays, *P<0.01 vs. the anti-IgG group,. (K) miR-139-5p expression was assessed in AGS and MGC-803 cells following sh-SNHG transfection. *P<0.01 vs. the sh-NC group. (L) miR-139-5p expression was quantified in AGS and MGC-803 cells following pcDNA3.1-SNHG3 transfection. *P<0.01 vs. the pcDNA3.1-NC group.