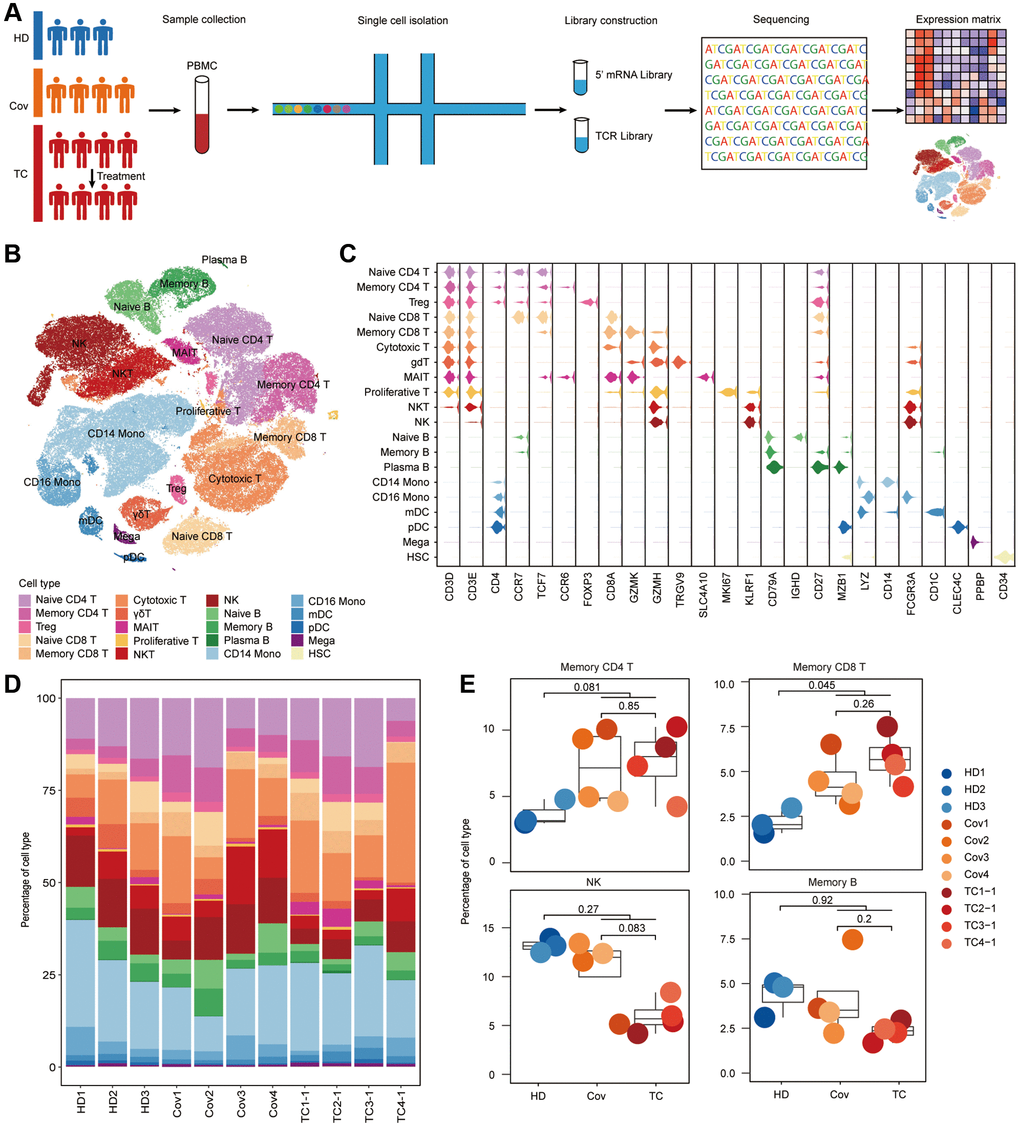
Figure 1.Differences in cell compositions by single-cell transcriptomes of PBMCs. (A) Schematic of the study design. (B) t-SNE plot of cells colored by cell types identified from HDs (n = 3), Covs (n = 4), TCs before treatment (n = 4). (C) Expression of selected canonical markers using violin plots in each cell type. (D) Proportion of each cell type in each sample. Bars are colored by cell types. (E) Box plots of proportion of cell types in each group. Shown are Memory CD4+ T, Memory CD8+ T, NK and Memory B cells. Samples are shown in different colors. Horizontal lines represent median values, with a maximum of 1.5× interquartile range. t-tests were conducted between each group and p-values indicated. t test was performed using R (version 4.0). *p < 0.05, **p < 0.01, ***p < 0.001.