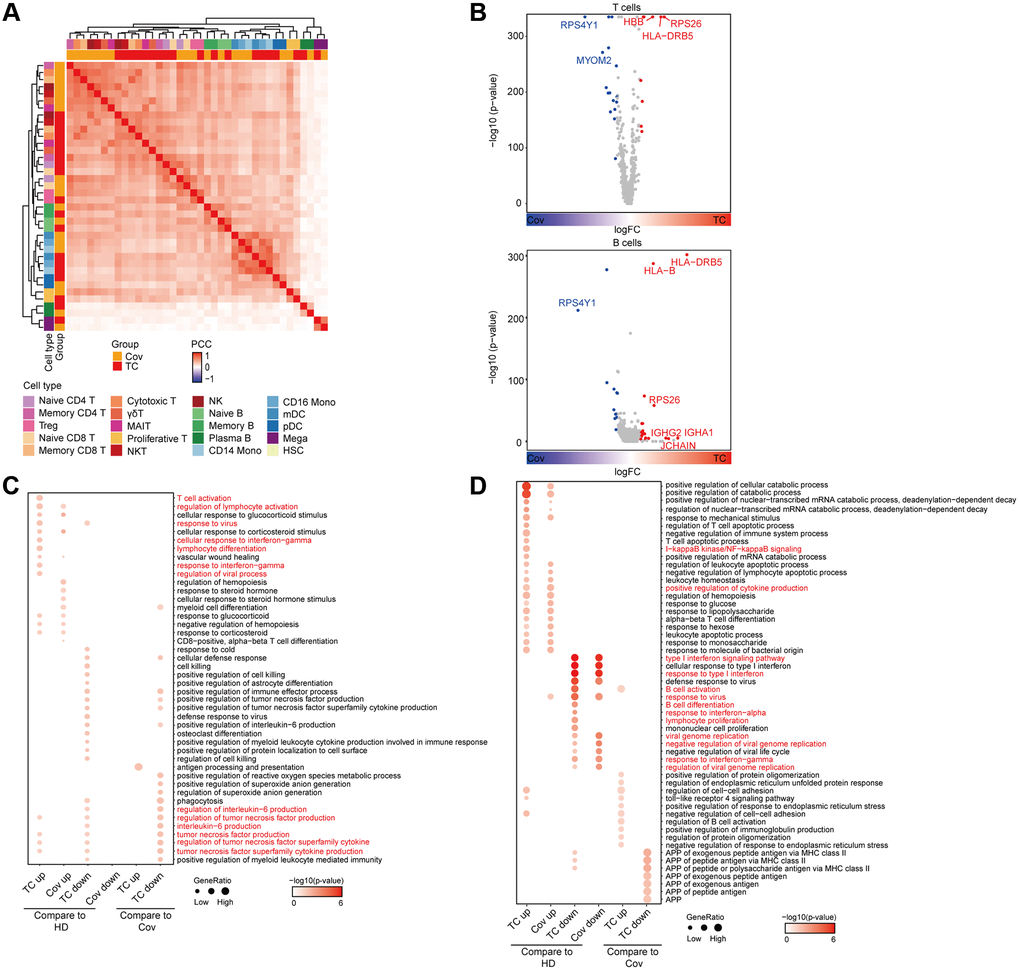
Figure 2.Analysis of functional changes between TCs and Covs. (A) Hierarchical clustering using the Pearson Correlation Coefficient (PCC) of a normalized transcriptome change between disease groups and HDs at cell type resolution. The color intensity indicates the PCC and the color bars above the heatmap indicate the cell type and disease group. (B) Differentially expressed genes in TCs compared to Covs in T and B cells. Red dots represent genes upregulated in TCs (logFC ≥ 0.25 and adjusted p < 0.05), while blue dots represent genes downregulated in TCs (logFC ≤ −0.25 and adjusted p < 0.05). Genes with |logFC| > 0.5 were labeled by gene symbols. (C, D) Enriched GO pathways of COVID-19 groups in T (C) and B (D) cells (left 4 columns: DEGs for TCs and Covs compared to HDs, right 4 columns: DEGs between TCs and Covs). The color intensity indicates the enrichment p-values and the point size indicates the ratio of gene enrich in each pathway.