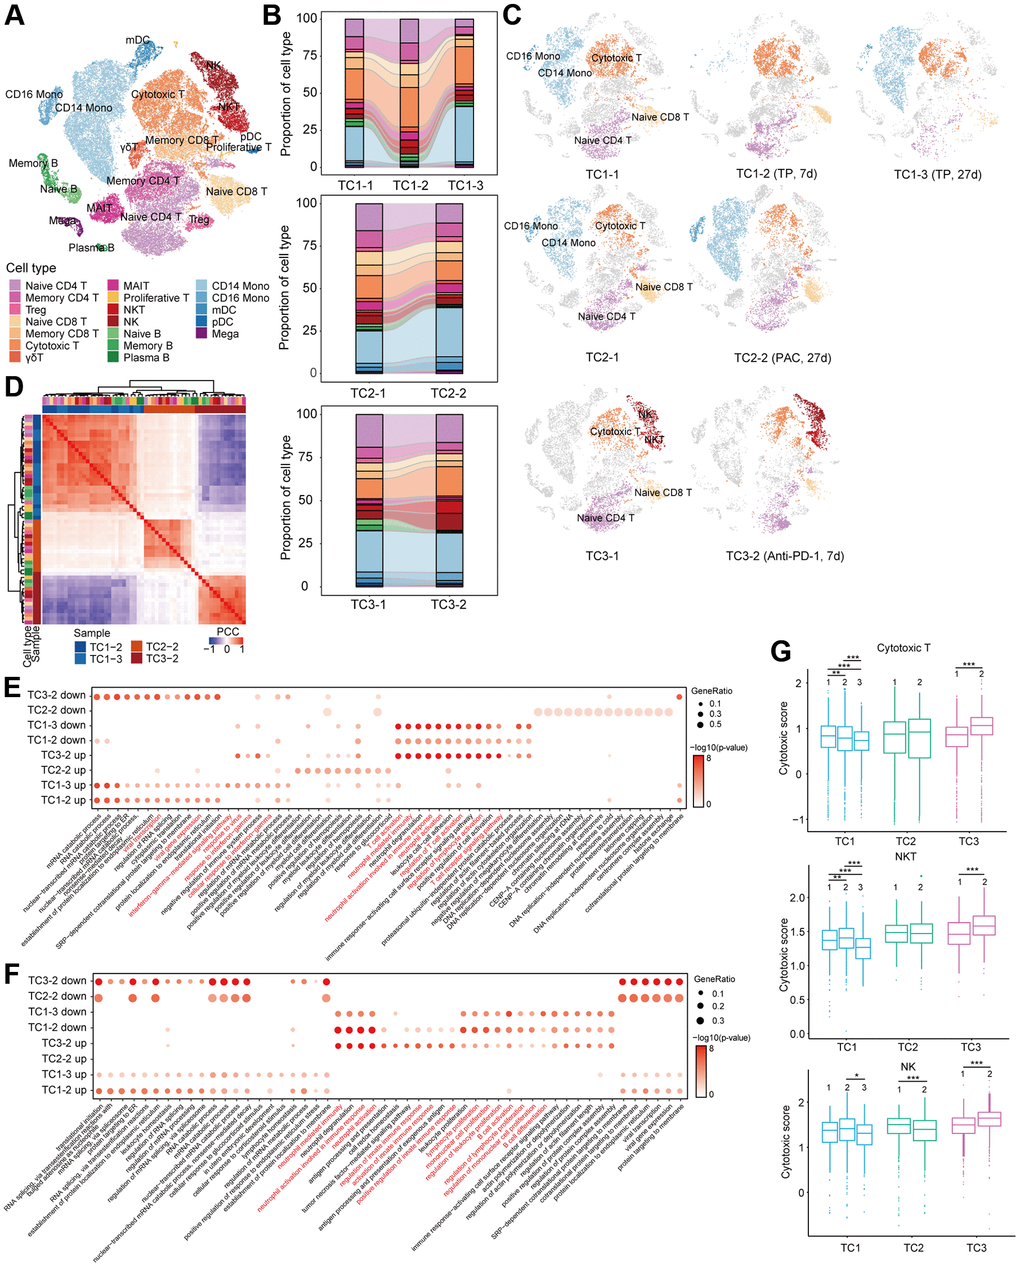
Figure 3.Compositional and functional changes of cells pre- and post-treatment in COVID-19 patients with tumor. (A) t-SNE plot of cells colored by cell types identified from COVID-19 patients with tumor pre- and post-treatment. (B) Proportion of each cell type in each person before and after treatment. Bars are colored by cell types. (C) t-SNE plot of cells in each person at different time point before and after treatment. (D) Hierarchical clustering using the Pearson Correlation Coefficient (PCC) of a normalized transcriptome change between post- and pre-treatment in lymphocytes at cell type resolution. The color intensity indicates the PCC and the color bars above the heatmap indicate the cell type and disease group. (E, F) Enriched GO pathways of COVID-19 patients with tumor after treatment in T (E) and B (F) cells (top 4 columns: downregulated GO pathways after treatment, bottom 4 columns: upregulated GO pathways after treatment). The color intensity indicates the enrichment p-values and the point size indicates the ratio of gene enrich in each pathway. (G) Box plot of cytotoxic scores for each patient in cytotoxic T, NKT and NK cells. *p < 0.05, **p < 0.01, ***p < 0.001.