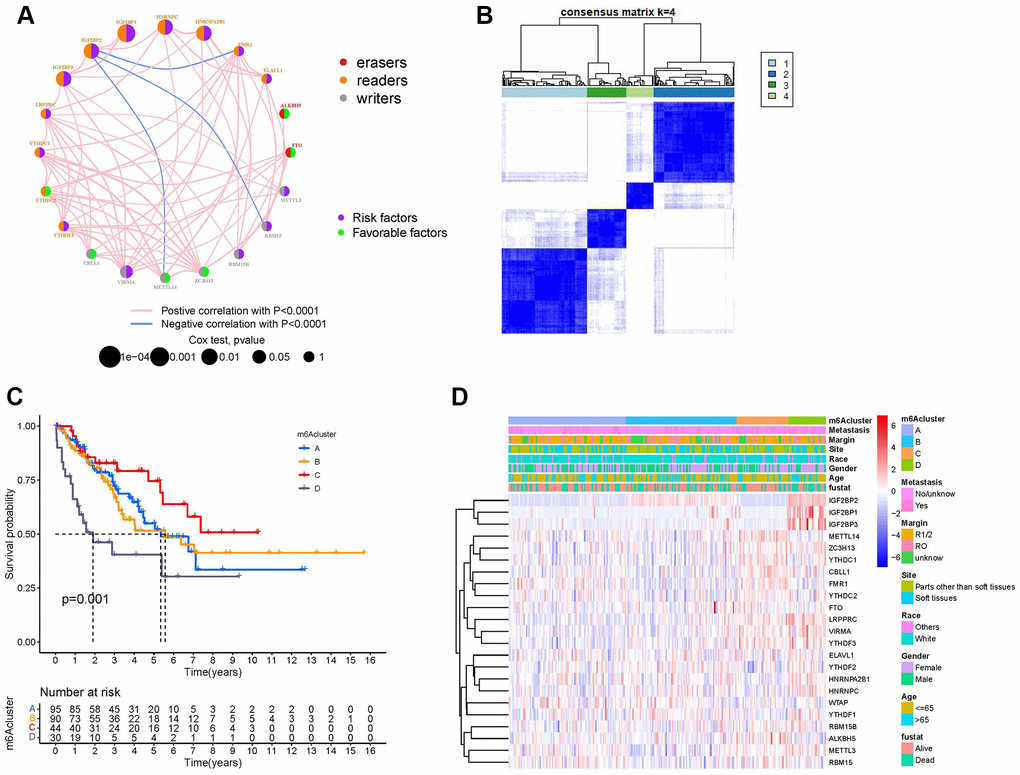
Figure 3.Establishment of m6A methylation modification patterns. (A) Regulatory functions and interactions of the 23 m6A regulators in sarcoma. The size of the circle represents the influence of different regulators on prognosis, while the Log-rank test was used to calculate values ranging from P < 1e−4, P < 0.001, P < 0.01, P < 0.05, and P > 0.05. Purple dots in circles, prognostic risk factors; green dots in circles, prognostic favorable factors. Erasers, readers, and writers are indicated by red, orange, and gray dots, respectively. The regulators' lines show their interactions, with negative correlations marked in blue and positive correlations in red. (B) The consensus matrix heatmap defined four m6A methylation modification clusters from 259 patients with sarcoma. (C) Kaplan-Meier curves of the overall survival rates of 259 patients with sarcoma with four m6A methylation modification clusters. (D) The heat map shows the expression levels of 23 m6A regulators in different m6A modification clusters and various clinicopathological features.