


Introduction
RNA modification is a form of post-transcriptional regulation, and RNA methylation accounts for 60% of all RNA modifications, among which the N6-methyladenosine (m6A) methylation is the most common type [1, 2]. The m6A methylation of RNA is a methylation modification formed by the 6th N of adenine (A) catalyzed by methyltransferase [3]. All m6A methylation reactions require the involvement of methyltransferases (Writers), demethylases (Erasers), and m6A-binding proteins (Readers) to perform the biological functions [4]. As a dynamic and reversible modification, m6A modification can directly or indirectly affect the biological processes of RNA transport, degradation, translation, and splicing [1]. Increasing evidence suggests that disordered expression of m6A regulators is closely associated with tumor immunity, tumor microenvironment, tumorigenesis, and tumor metastasis [5–7].
Sarcoma is a group of highly heterogeneous tumors that originate from the mesenchymal stromal cells. The five-year survival rate is 10–20% in patients with advanced sarcoma [8]. In clinical practice, the lack of knowledge of the molecular mechanisms of sarcoma development often leads to limitations in treatment tools and delays in the treatment period, especially in patients with advanced sarcomas. At present, the molecular regulatory mechanisms of sarcoma have not yet been fully elucidated. Notably, an increasing number of studies have shown that changes in the tumor immune microenvironment (TIME) play a key role in the occurrence and development of sarcoma [9, 10].
TIME is a complex ecosystem containing adaptive and innate immune cells with both pro-and anti-tumor properties [11]. Due to the diversity of its composition, TIME has a variety of possible cancer treatment targets [12]. With the development of immunotherapy, the treatment of malignancies has changed dramatically. Immunotherapy with immunological checkpoint inhibitors (ICIs), cytotoxic T lymphocyte-associated antigen-4 (CTLA-4), programmed cell death protein-1 (PD-1), and PD-ligand 1 (PD-L1) have demonstrated impressive clinical efficacy in patients with sarcoma [13, 14]. Unfortunately, 77.1% of patients with sarcoma receive little or no clinical benefit from ICIs [15]. Thus, TIME can identify different tumor immunophenotypes and improve the ability to guide and predict the immunotherapy response by comprehensively resolving the heterogeneity and complexity of immune cells in TIME [16].
Recent studies have revealed a potential connection between TIME and m6A modifications in various types of cancers [17, 18]. In a study of gastric cancer, Bo Zhang et al. demonstrated that assessment of m6A regulator expression patterns could predict the inflammation level, subtype, genetic variation, patient prognosis, and TIME [7]. Xin Liu et al. showed that methyltransferase-like (METTL)-14 (an m6A writer) overexpression inhibited gastric cancer cell proliferation and invasion by regulating the phosphoinositide 3-kinase/serine-threonine kinase/mammalian target of rapamycin (PI3K/AKT/mTOR) signaling pathway [19]. In addition, Botai et al. demonstrated that circNDUFB2 (a circular RNA) is involved in the degradation of the insulin-like growth factor 2 (IGF2) mRNA-binding protein 2 (IGF2BP2) (an m6A reader) during the progression of non-small cell lung cancer, which in turn activates anti-tumor immunity [20]. However, the potential roles of m6A modifications in the TIME of sarcomas remain unclear. Understanding the relationship between m6A methylation and TIME is important for further understanding the changes in immune transition during the development of sarcoma and accurately identifying potential new targets for the early diagnosis and effective treatment of sarcoma.
Therefore, a systematic evaluation of the connection between m6A regulator expression patterns and TIME will help improve our understanding of the sarcoma immune transition. In this study, we integrated genomic information from 259 sarcoma samples to systematically analyze m6A regulator expression patterns and combine them with the TIME landscape. We identified four m6A modification clusters and established an m6A scoring system to quantify individual patients with sarcoma to predict and guide their immunotherapy.
Results
Landscape of m6A regulators in sarcoma
The workflow of our study is shown in Figure 1. Through literature search and analysis, we identified a total of 23 m6A regulators, including 13 readers, eight writers, and two erasers (Supplementary Table 1). We summarized the process by which m6A regulators could add or remove m6A modification sites and change the potential biological functions of RNA splicing, translation, and degradation (Figure 2A). The investigation of copy number variation (CNV) alteration frequency showed a prevalent CNV alteration in 23 m6A regulators, and ALKB homolog 5 (ALKBH5), METTL3, heterogeneous nuclear ribonucleoprotein (HNRNP)-C, and ELAV-like 1 (ELAVL1) showed widespread CNV frequency gains. In contrast, METTL15, zinc finger CCCH-type containing 13 (ZC3H13), fat mass and obesity-associated (FTO), leucine-rich pentatricopeptide repeat containing (LRPPRC), and RNA-binding motif protein 15B (RBM15B) showed widespread CNV frequency loss (Figure 2B). We further searched for the position of CNV alteration in the m6A regulator on the chromosome (Figure 2C). We can completely distinguish sarcoma samples (259 sarcoma samples from The Cancer Genome Atlas [TCGA] database) from normal samples (911 muscle and adipose tissue samples from the University of California Santa Cruz [UCSC] Xena database) based on the expression levels of these 23 m6A regulators (Figure 2D). The median overall survival (OS) of patients with sarcoma was found to be 2.57 years (IQR = 1.3–4.34 years). Among them, Vir-Like m6A methyltransferase associated (VIRMA), METTL14, METTL3, Wilms tumor 1 (WT1)-associated protein (WTAP), fragile-X mental retardation 1 (FMR1), HNRNPA2B1, HNRNPC, IGF2BP3, LRPPRC, YTH domain containing (YTHDC)-1, YTHDC2, and FTO were highly expressed in normal tissues, while RBM15, RBM15B, ZC3H13, ELAVL1, IGF2BP1, YTH m6A RNA-binding protein (YTHDF)-1, YTHDF3, and ALKBH5 were highly expressed in sarcoma tissues. The expression levels of Cbl-like 1 (CBLL1) and IGF2BP2 in normal and sarcoma tissues were not statistically significant. Gene Ontology (GO) enrichment results are shown in Supplementary Figure 1A. We then used Cox regression analysis and Kaplan-Meier (K-M) analysis to determine the relationship between m6A regulators and the prognosis of patients with sarcoma. Univariate Cox regression analysis showed that the expression levels of IGFBP2 (P-value = 0.002), VIRMA (P-value = 0.039), IGFBP1 (P-value <0.001), HNRNPC (P-value = 0.009), HNRNPA2B1 (P-value = 0.004), YTHDF2 (P-value <0.001), and IGF2BP3 (P-value = 0.005) were protective factors for patients with sarcoma (Supplementary Figure 1B and Supplementary Table 2). At the same time, we calculated the K-M value of m6A regulators in patients with sarcoma by each best cut-off point (Supplementary Table 3) and the survival curve of m6A regulators (Supplementary Figure 2A–2W).
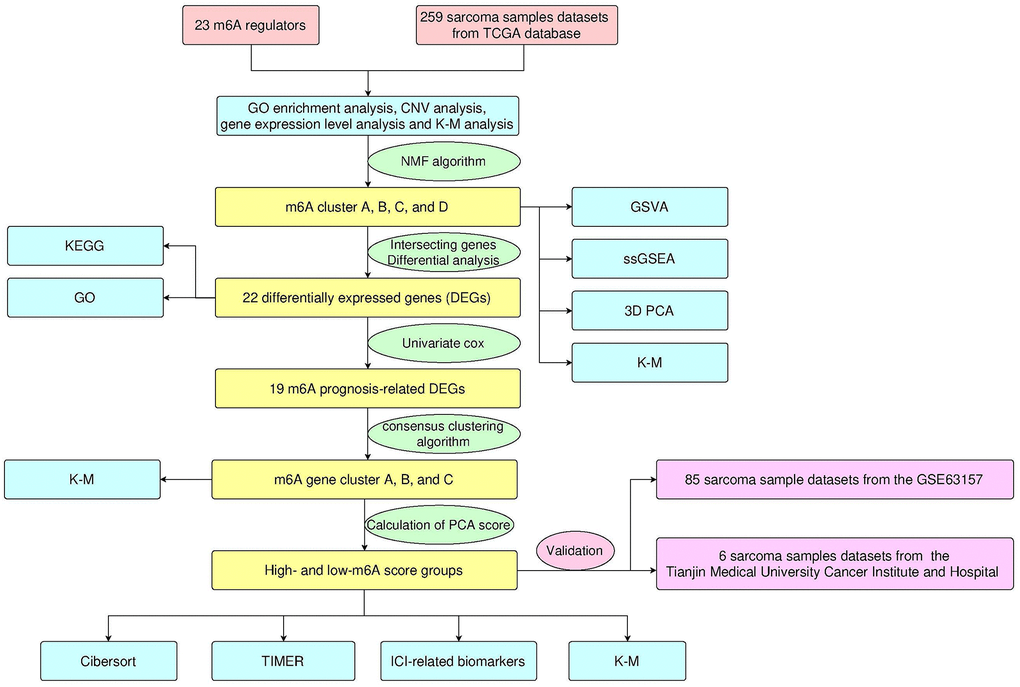
Figure 1. Design and workflow of the study.
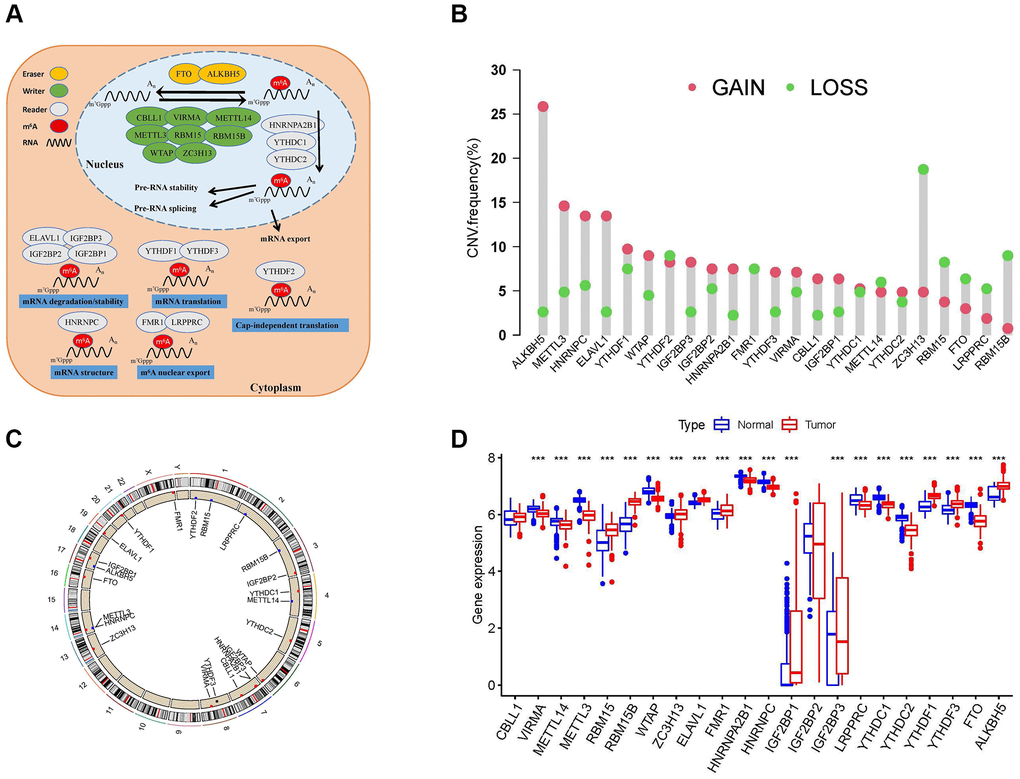
Figure 2. Landscape of N6-methyladenosine (m6A) regulators in patients with sarcoma. (A) Regulation of m6A regulators and their biological functions in RNA metabolism. A total of 23 known m6A regulators, including 13 readers, 8 writers, and 2 erasers. m6A methylation involves multiple stages of the RNA life cycle, including pre-mRNA shearing, pre-mRNA splicing, pre-mRNA transport, RNA translation, RNA degradation, etc. (B) Copy number variation (CNV) mutations in 23 m6A regulators. (C) The location of CNV alterations of m6A regulators on chromosomes. (D) Differential expression levels of 23 m6A regulators between normal tissues (Adipose and muscle tissues) and tumor tissues (sarcoma samples). Asterisks represent the statistical P-values (*P < 0.05; **P < 0.01; ***P < 0.001).
Identification of m6A methylation modification patterns
The m6A regulator network describes the association between the 23 m6A regulators, their interactions, and their prognostic significance in patients with sarcoma (Figure 3A). The results of the m6A regulatory network indicate that the interaction between writers, readers, and erasers may play unique roles in the formation of different m6A regulator expression patterns and affect the prognosis of patients with sarcoma [21, 22]. We used non-negative matrix factorization (NMF) consistent clustering to classify the sarcoma samples and identified four m6A modification clusters (Figure 3B and Supplementary Figure 3A–3J), namely, m6A-cluster-A, m6A-cluster-B, m6A-cluster-C, and m6A-cluster-D. K-M analysis showed that m6A-cluster-C had a significant survival advantage, while m6A-cluster-D showed a poor prognosis (Figure 3C). A heat map showed the differential expression patterns of 23 m6A regulators in four different m6A modification clusters (Figure 3D).
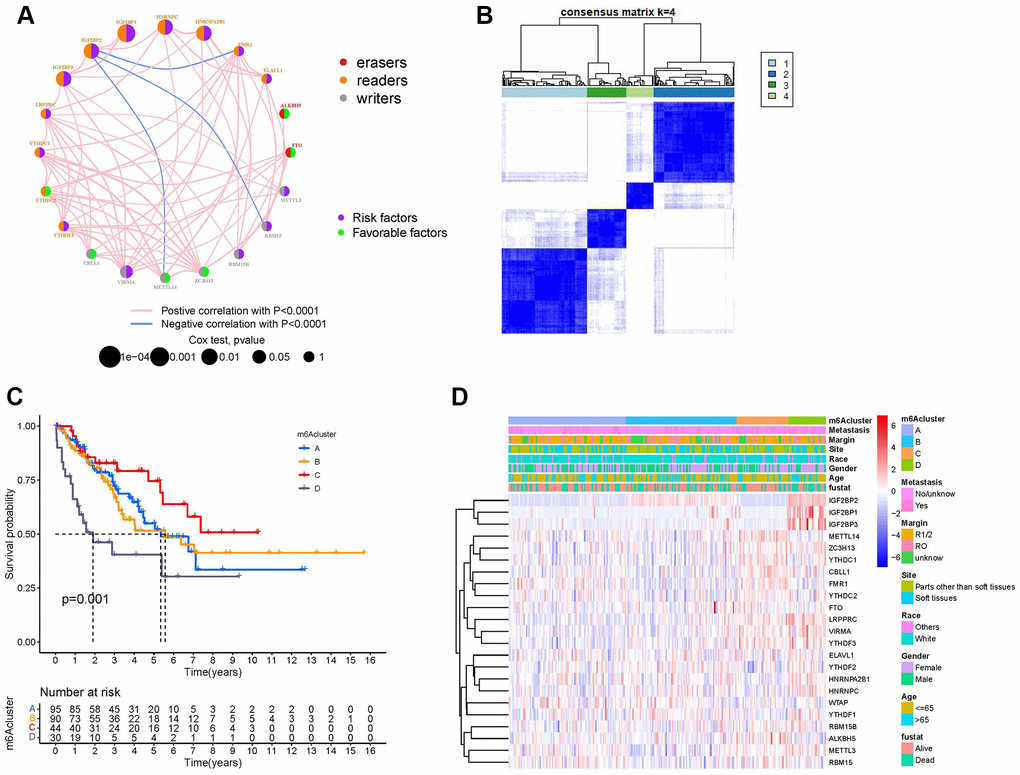
Figure 3. Establishment of m6A methylation modification patterns. (A) Regulatory functions and interactions of the 23 m6A regulators in sarcoma. The size of the circle represents the influence of different regulators on prognosis, while the Log-rank test was used to calculate values ranging from P < 1e−4, P < 0.001, P < 0.01, P < 0.05, and P > 0.05. Purple dots in circles, prognostic risk factors; green dots in circles, prognostic favorable factors. Erasers, readers, and writers are indicated by red, orange, and gray dots, respectively. The regulators' lines show their interactions, with negative correlations marked in blue and positive correlations in red. (B) The consensus matrix heatmap defined four m6A methylation modification clusters from 259 patients with sarcoma. (C) Kaplan-Meier curves of the overall survival rates of 259 patients with sarcoma with four m6A methylation modification clusters. (D) The heat map shows the expression levels of 23 m6A regulators in different m6A modification clusters and various clinicopathological features.
TIME landscape characteristics in four m6A regulator expression patterns
To explore the biological behavior of the four different m6A modification types, we performed pairwise gene set variation analysis (GSVA) enrichment analysis (Figure 4A–4F). GSVA results showed that m6A-cluster-A was significantly rich in material metabolism (amino acid and lipid metabolism) and human diseases (immune-related, such as systemic lupus erythematosus and primary immunodeficiency). It is worth noting that material metabolism-related processes, especially glucose metabolism, are enriched in m6A-cluster-B. The pathways enriched by m6A-cluster-C are phosphoinositide transduction and metabolism and human diseases (circulatory system related). The pathways enriched by m6A-cluster-D are mainly metabolism-related pathways (such as glycan metabolism and lipid metabolism) and human disease-related signaling pathways (basal cell carcinoma and diabetes). Surprisingly, GSVA results showed that the signaling pathways with high expression between different clusters were mostly material metabolism- and immune-related, further confirming a direct or indirect link between m6A regulator expression patterns and TIME. In addition, we constructed a visible box-line plot by the “ssGSEA” package to compare the differences in the relative abundance of 28 immune infiltrating cell subpopulations in 4 different m6A clusters (Figure 4G). Statistically significant differences in immune cell infiltration results indicate the reliability of the m6A cluster in elucidating the immunophenotyping of TIME. Three-dimensional PCA (3D PCA) analysis was performed in four different m6A clusters based on the expression of 23 m6A regulators. 3D PCA and its projection on the three planes (Figure 4H–4K) showed that the distribution of four different m6A modification clusters was disorderly.
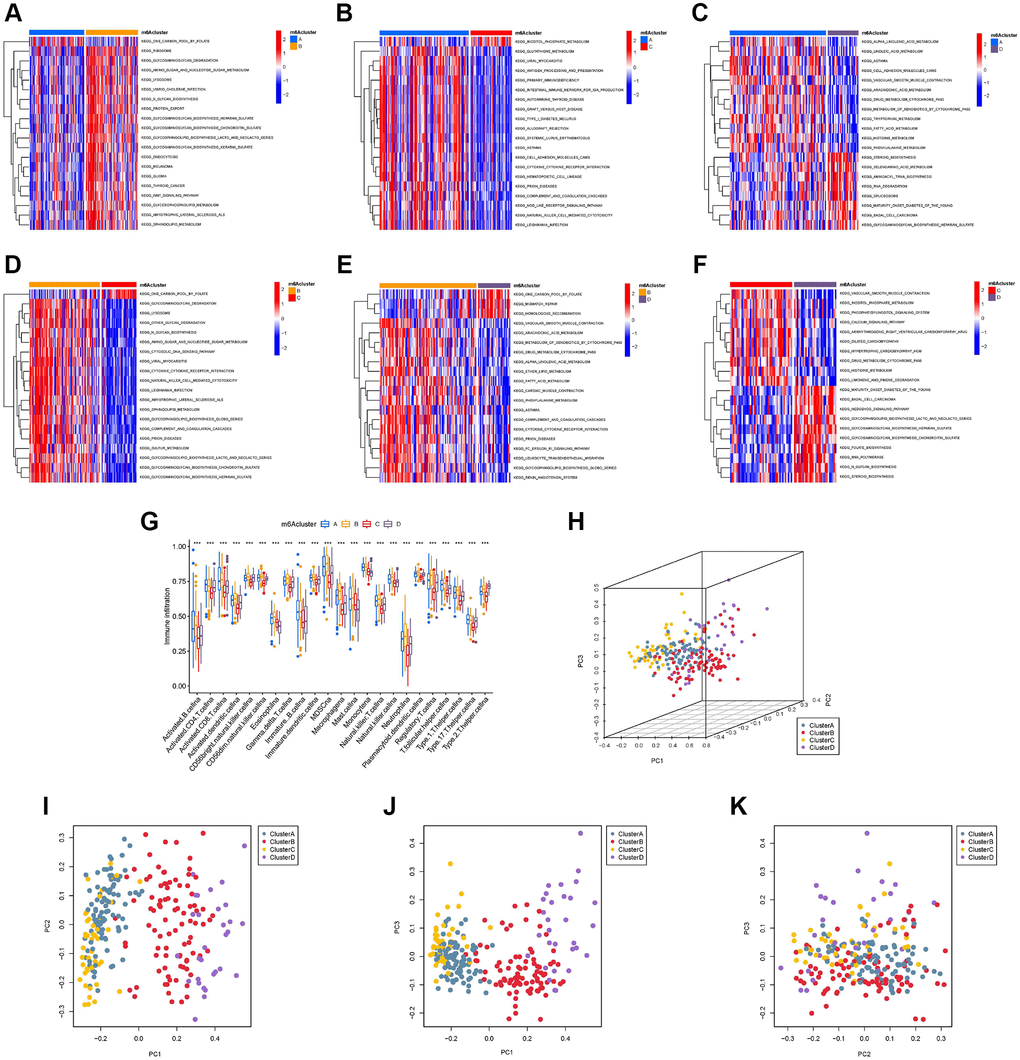
Figure 4. Gene set variation analysis (GSVA), single sample gene set enrichment analysis, and principal component analysis (PCA). The heat map shows the GSVA scores of representative hallmark passages by comparing two by two m6A regulator expression patterns. (A) m6A cluster-A vs. m6A cluster-B; (B) m6A cluster-A vs. m6A cluster-C; (C) m6A cluster-A vs. m6A cluster-D; (D) m6A cluster-B vs. m6A cluster-C; (E) m6A cluster-B vs. m6A cluster-D; (F) m6A cluster-C vs. m6A cluster-D; (G) Abundance of infiltrating cells in each of the four m6A modification patterns. Asterisks represent the statistical P-values (*P < 0.05; **P < 0.01; ***P < 0.001). (H) Three-dimensional PCA (3D PCA) results of four m6A modification clusters, showing significant differences in the transcriptome between different modification clusters. (I) Projection of 3D PCA on the first principal component (PC1) and the second principal component (PC2). (J) Projection of 3D PCA on PC1 and the third principal component (PC3). (K) Projection of 3D PCA on PC2 and PC3.
Generation of m6A gene signatures and functional annotation
To deeply explore the potential biological functions of the four m6A regulator expression patterns, we analyzed the differentially expressed genes (DEGs) of the two m6A modification clusters using the “limma” package and took the intersection (Figure 5A and Supplementary Table 4). Finally, we identified 22 m6A-related DEGs (Supplementary Table 5). Surprisingly, based on the results of GO (Figure 5B) and Kyoto Encyclopedia of Genes and Genomes (KEGG) (Figure 5C), these 22 m6A DEGs showed that tumor metabolism was closely related to m6A modification, which reinforces that m6A modification plays a non-negligible role in TME. We further performed univariate Cox analysis on 22 DEGs and obtained 19 prognosis-related DEGs (Supplementary Table 6). To further validate the mechanism between m6A and TIME, we performed consensus clustering analysis based on the 19 m6A prognosis-related DEGs. We classified the samples into three different genomic subtypes and named these three clusters as m6A gene clusters A, B, and C (Figure 5D and Supplementary Figure 4A–4J). Heat map showing differences in the expression of 19 m6A prognosis-related DEGs in the three m6A gene clusters (Figure 5E). K-M analysis results showed that m6A gene cluster B had a significant survival advantage, while m6A gene cluster C had a poor prognosis (Figure 5F). Immediately afterward, we found significant differences in the expression of m6A regulators among the three m6A gene clusters (Figure 5G).
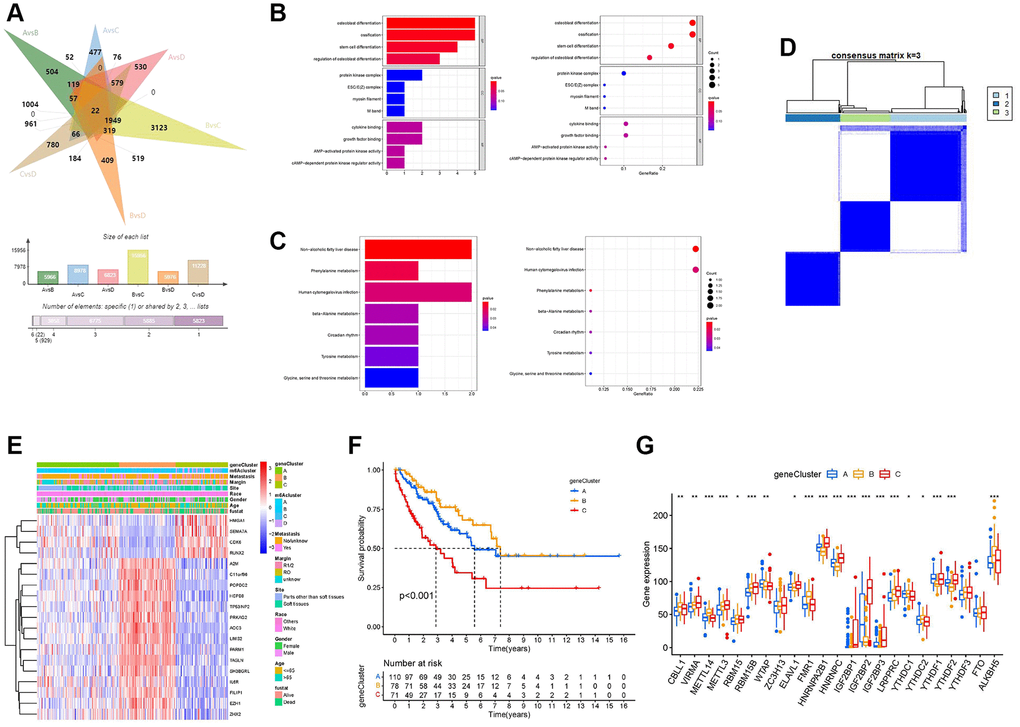
Figure 5. Development of the m6A score and exploration of functional annotation. (A) Venn diagram showing 22 m6A-associated differentially expressed genes (DEGs) between the six clusters compared. (B) Functional annotation of m6A-related DEGs using Gene Ontology (GO) enrichment analysis. (C) Functional annotation of m6A-related DEGs using Kyoto Encyclopedia of Genes and Genomes (KEGG) enrichment analysis. (D) The consensus matrix heatmap defined three m6A gene clusters. (E) The heat map shows the expression levels of 22 m6A-related DEGs in different m6A gene clusters and various clinicopathological features. (F) Kaplan-Meier curves of the overall survival rates of 259 patients with sarcoma with three m6A gene clusters. (G) Expression levels of 23 m6A regulators in each of the three m6A gene clusters. Asterisks represent the statistical P-values (*P < 0.05; **P < 0.01; ***P < 0.001).
Development of the m6A score and its clinical significance
Although our studies have further confirmed the relationship between m6A modification in TIME and prognosis, these analyses cannot predict the pattern of m6A modification in patients with sarcoma and cannot assess the prognosis of these patients. Therefore, we developed a scoring scheme called the m6A score to quantify the m6A regulator expression pattern in each sarcoma patient (Supplementary Table 7). We used a Sankey plot to illustrate the workflow (Figure 6A). The Kruskal-Wallis test showed that there were significant differences in m6A scores between the m6A clusters. The median of m6A cluster C was the lowest, and the median of m6A cluster D was the highest, indicating that a high m6A score may be closely related to the characteristics of material metabolism, while a low m6A score may be related to immune cell infiltration (Figure 6B). At the same time, m6A gene cluster C showed the highest median score of m6A, and m6A cluster B showed the lowest median score (Figure 6C). The results of the K-M curve showed that patients with high m6A scores had a shorter survival time than those with a low score group (Figure 6D). In different clinicopathological characteristics (age, race, sex, site, margin status, and metastasis status), it was further confirmed that the prognosis of patients with high m6A scores was worse than that of patients with low m6A scores (Supplementary Figure 5A–5L). We drew the receiver operating characteristic (ROC) curve to further explore the prediction function of the m6A score for patients with sarcoma. We found that the AUC of m6A score was 0.748, which is much larger than the AUC of other clinicopathological features, and the m6A score can predict the prognosis of patients with sarcoma (Figure 6E). The m6A score was validated in GSE63157, and the AUC value of the validation cohort was 0.675 (Figure 6F). Additionally, the validation cohort GSE63157, survival curves showed that low-risk patients had a favorable prognosis than high-risk patients (P < 0.001, Figure 6G).
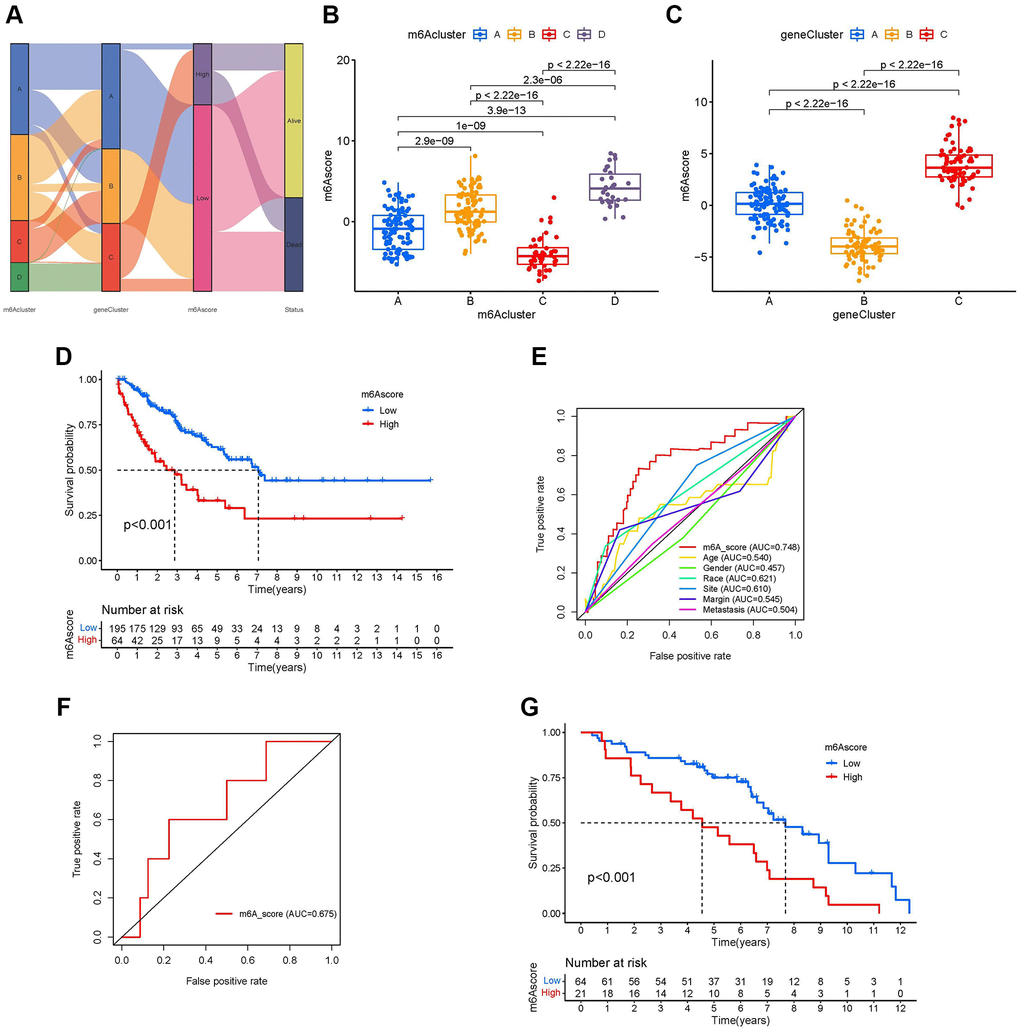
Figure 6. Development of the m6A score and exploration of m6A-related clinical features. (A) Sankey diagrams of different m6A modification clusters, m6A gene clusters, m6A scores, and different prognosis status. (B) Differences in the m6A scores among four m6A modification clusters (P-value <0.001, Kruskal-Wallis test). (C) Differences in the m6A scores among three m6A gene clusters (P-value <0.001, Kruskal-Wallis test). (D) Survival analyses for low-and high-m6A score groups using Kaplan-Meier curves (P-value < 0.001, Log-rank test). (E) Comparison of the area under the receiver operating characteristic curve between the m6A score and clinicopathological characteristics. (F) The receiver operating characteristic curve of m6A score in the validation set GSE63157 (Area under curve = 0.675). (G) Survival analyses for low- and high-m6A score groups using Kaplan-Meier curves in validation set GSE63157 (P-value < 0.001, Log-rank test).
Role of the m6A score in immunotherapy
Using the Tumor Immune Estimation Resource (TIMER), we evaluated the association between the prognostic features and immune cell infiltration. The results indicated that DC (Cor = –0.175, P-value = 0.005, Figure 7A), macrophages (Cor = –0.320, P-value <0.001, Figure 7B), CD4+ T cells (Cor = –0.177, P-value = 0.005, Figure 7C), and neutrophils (Cor = −0.279, P-value <0.001, Figure 7D) were significantly negatively correlated with the m6A score. The other two types of immune cells, CD8+ T cells (Figure 7E) and B cells (Figure 7F) were not significantly different from the m6A score. Immune cell infiltration analysis results of TIMER further confirmed that a low m6A score might be related to immune cell infiltration. In addition, using CIBERSORT, we assessed the difference in immune cell infiltration between the high-m6A score group and the low-m6A score group. The results of CIBERSORT showed that the infiltration degrees of activated B cells, memory T cells, CD4+ T cells, M0 and M2 macrophages, and mast cells were higher in the high-m6A score group than in the low-m6A score group; in contrast, the infiltration degrees of naïve B cells, M1 macrophages, and resting mast cells were higher in the low-m6A score group than in the high-m6A score group (Figure 7G). Immune cell infiltration analysis results of CIBERSORT showed that different m6A scores had different immune cell types infiltrated in TIME. Based on the m6A score, we divided six patients from Tianjin Medical University Cancer Institute and Hospital into a low-m6A score group (four samples) and a high-m6A score group (two samples) and plotted their immune cell infiltration heat map (Figure 7H). By analyzing the degree of immune cell infiltration in the external validation set of the six patients, we further confirmed the conclusion that macrophage M2 and neutrophils were higher in the high-m6A score group than in the low-m6A score group (Figure 7I). The results of ICI-related biomarker analysis showed that the expression of TIM-3 (p = 0.005) was higher in the high-m6A score group than in the low-m6A score group (Figure 7J). The validation set GSE63157 high-m6A score group also had a higher level of TIM-3 expression than the low-m6A score group (Figure 7K). However, there was no statistical difference in the expression of PD1 (Figure 7L), PD-L1 (Figure 7M), CTLA4 (Figure 7N), T cell immunoglobulin and ITIM domain (TIGIT) (Figure 7O), and lymphocyte activation gene-3 (LAG3) (Figure 7P) between the high- and low-m6A score groups.
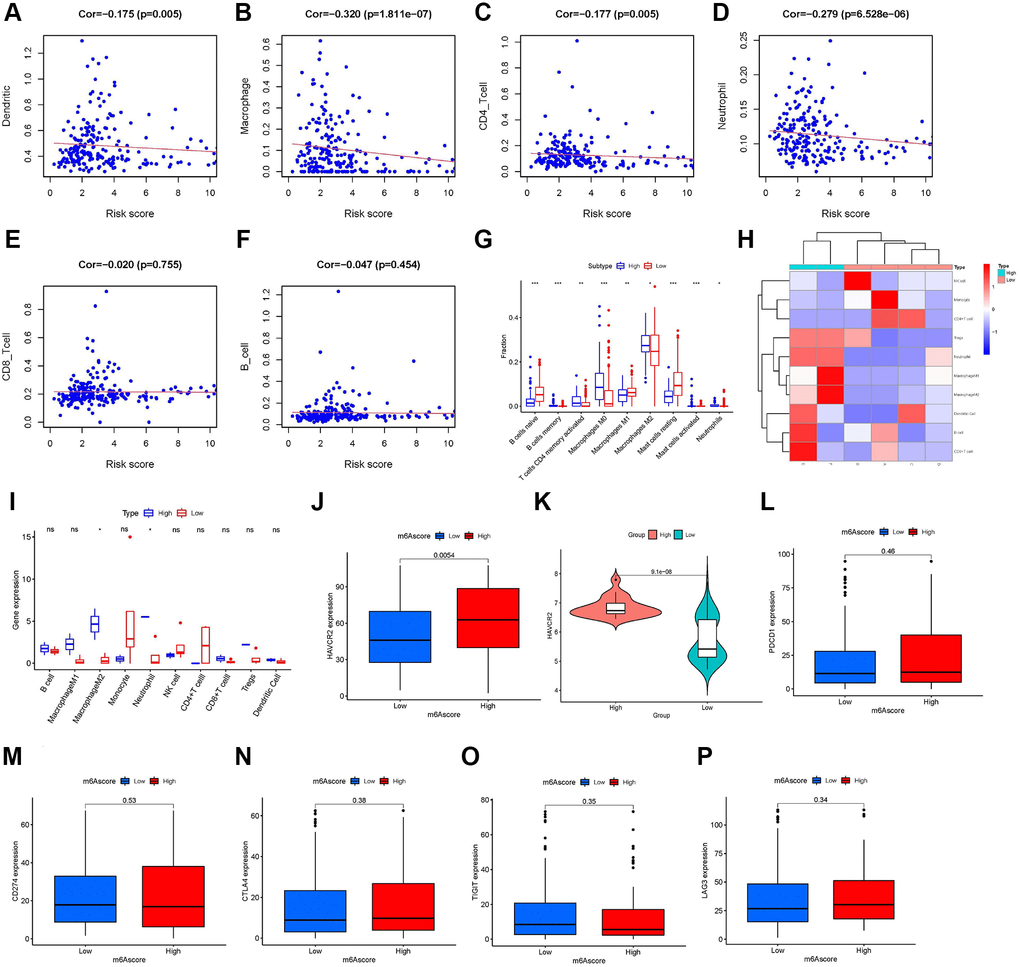
Figure 7. Role of the m6A score in immunotherapy. Infiltration abundances of six types of immune cells (Pearson correlation analysis). (A) Dendritic Cells (Cor = –0.175, P-value = 0.005). (B) Macrophages (Cor = –0.320, P-value <0.001). (C) CD4+ T cells (Cor = –0.177, P-value = 0.005). (D) Neutrophil (Cor = –0.279, P-value <0.001). (E) CD8+ T cells (Cor = –0.020, P-value = 0.755). and (F) B cells (Cor = –0.047, P-value = 0.454). (G) Box plots visualizing significantly different immune cells between high- and low-m6A score groups. Infiltration degrees of naive B cells, M1 macrophages, and resting mast cells were higher in the low-m6A score group than the high-m6A score group. Meanwhile, the infiltration degrees of memory B cells, activated memory CD4 T cells, M0 and M2 macrophages, and activated mast cells were higher in the high-m6A score group than the low-m6A score group. (H) Ten immune cells infiltration heat map of the six patients from Tianjin Medical University Cancer Institute and Hospital. (I) Infiltration degrees of M2 macrophages and neutrophils were higher in the high-m6A score group than the low-m6A score group in the six patients validation set. The box plot shows the differences in (J) hepatitis A virus cellular receptor 2 (HAVCR2) between high- and low-m6A score groups in TCGA database, (K) HAVCR2 between high- and low-m6A score groups in the validation set, GSE63157, and (L) programmed cell death 1 (PD-1), (M) CD274, (N) cytotoxic T lymphocyte-associated antigen-4 (CTLA-4), (O) T cell immunoglobulin and ITIM domain (TIGIT), and (P) lymphocyte activation gene-3 (LAG3) between high- and low-m6A score groups in The Cancer Genome Atlas (TCGA) database. Asterisks represent the statistical P-values (*P-value <0.05; **P-value <0.01; ***P-value <0.001).
Discussion
With the development of next-generation sequencing technology, m6A modifications have been detected in innate immune diseases, inflammation, and various tumors [5, 6, 23]. m6A modifications can affect the transcriptional translation of mRNA and/or non-coding RNA of related genes by regulating the methylation at the cellular RNA level, thus activating cellular signal transduction pathways and affecting cell proliferation, differentiation, migration, invasion, apoptosis, DNA damage repair, etc. [24, 25]. Currently, most studies are focused on single or multiple m6A modulators, and there is a lack of comprehensive analysis of the role of m6A modulators in sarcoma TIME [22]. Recognition of the characteristics of different m6A regulator expression patterns in TIME will help enhance our understanding of TIME and allow for a more effective evaluation of patient prognosis and guidance of immunotherapy.
This study identified four different m6A clusters with different TIME characteristics, including different immune-related pathways, degree of immune cell infiltration, and different material metabolism-related pathways. Among the four different m6A clusters, m6A-cluster-C had a significant survival advantage, while m6A-cluster-D had a poor prognosis. This may be closely related to the high synthesis and metabolism of lipids and glycans in the TIME of m6A-cluster-D [26]. Jiang et al. demonstrated that increased glycolysis is closely associated with elevated immune activity in TIME [27]. In our study, this pattern may also exist in m6A-cluster-B, where both glucose metabolism and the level of immune cell infiltration were higher than other three m6A-clusters. Combining the immune cell infiltration characteristics of each m6A cluster with the PCA results, we further confirmed the reliability of the fact that different m6A regulator expression patterns have different immune phenotypes. Therefore, in this study, mRNA and/or non-coding RNA differences between different m6A clusters were significantly associated with m6A modification and TIME. However, the relationship between DEGs and TIME of different m6A clusters is unclear. Therefore, we searched for intersecting genes to further explore the relationship between m6A-related genes and TIME. We then used univariate Cox regression to analyze the intersection genes to identify 19 prognosis-related DEGs. These DEGs were considered m6A-related signature genes, and these DEGs were also closely associated with the TME. Interestingly, we used consensus clustering similar to m6A regulator expression patterns, and three m6A gene clusters were identified based on prognosis-related DEGs. The expression of 23 m6A regulators was statistically different among the three subtypes. Among them, m6A gene cluster B had the best prognosis, and m6A gene cluster C had the worst prognosis. These results again illustrate that m6A regulators are significantly associated with TIME. Thus, a comprehensive assessment of m6A-associated DEGs enhances our understanding of the TIME landscape with different m6A regulator expression patterns.
Given the need for individualized prediction and treatment, quantification of m6A regulator expression patterns in patients with sarcoma, and enhancing the understanding of the TIME landscape, there is an urgent need to develop a novel m6A scoring system. To this end, we have developed a novel scoring system to assess m6A regulator expression patterns in patients with sarcoma, named the m6A score. Based on the results of the m6A score, patients with sarcoma were divided into high- and low-m6A score groups based on the optimal cut-off point. Through the common results of the two analysis methods, we found that the degree of immune cell infiltration in patients with sarcoma with high m6A score group was lower than that in patients with low m6A score groups (e.g., dendritic cells, macrophages, CD4+ T cells, and neutrophils). It is not difficult to infer from the previous conclusion that the prognosis of patients with a high degree of immune cell infiltration is worse [28, 29].
Moreover, our results further confirmed that the higher the m6A score, the lower the degree of immune cell infiltration, and the worse the prognosis of patients with sarcoma. The expression of TIM-3 has been observed in various tumor cells and immune cells [30]. It has been well documented that both protein and mRNA expression levels of TIM-3 are elevated in tumor tissue samples and that elevated TIM-3 is associated with poor prognosis in various tumors, including sarcomas [31, 32]. In our study, we found that TIM-3 expression was higher in the high m6A score group than in the low m6A score group, and based on the findings of the existing studies [31, 32], we again confirmed that the prognosis of patients with sarcoma in the high m6A score group was worse than that in the low m6A score group. However, we did not find differential expression of other ICI-related immune markers (PD1, PD-L1, CTLA4, TIGIT, and LAG3) between the high and low m6A score groups.
To confirm the reliability of the conclusions of the analysis of sarcoma samples from TCGA database, we performed validation using two independent datasets. The validation set was GSE63157 from GEO and six patients from the Tianjin Medical University Cancer Institute and Hospital. The validation set of six patients may cause some problems, such as an extensive confidence interval range, due to the small sample size. However, the results reflected by the two validation sets combined confirmed the value of clinical use of the m6A score to predict survival and assess the TIME landscape of patients with sarcoma. The validation results confirm that the m6A score can improve our understanding of the TIME landscape of sarcomas and predict and guide the treatment of patients.
Although the intrinsic association between m6A regulators and TIME in patients with sarcoma has been preliminarily investigated through statistical and bioinformatic analyses, our study still has some shortcomings. First, although we reviewed the literature and compiled a catalog of 23 recognized RNA methylation regulators, more m6A regulators will be discovered over time with development. Therefore, novel defined m6A regulators need to be enrolled in the study to refine the accuracy of m6A regulator expression patterns and m6A scores. Second, the external validation set consisting of six samples leads to a large confidence interval because of the small sample size, and the improvement of its validation capability requires further expansion of the sample size. Third, m6A regulator expression patterns, m6A-related DEGs, and m6A scores were identified using retrospective datasets; therefore, in vivo and in vitro experiments and prospective cohorts of patients with sarcoma are needed to further validate our findings. Finally, patients with sarcoma with a poorer prognosis were also included in the low m6A score group; therefore, additional clinicopathologic features should be incorporated into the prediction model to improve accuracy.
Conclusion
In this study, we comprehensively assessed the expression patterns of 23 m6A regulators in 259 sarcoma samples. m6A was evaluated integrally with TIME. This work further confirmed that m6A methylation modifications have important regulatory mechanisms in sarcoma TIMEs. Differences in m6A regulator expression patterns are responsible for the individual differences in sarcoma TIMEs. Therefore, a systematic evaluation of individual m6A regulator expression patterns will help to enhance our understanding of the sarcoma TIME landscape and predict and guide the treatment of affected patients.
Methods
Data collection and processing
Gene expression datasets and corresponding clinical datasets (including age, race, gender, site, margin status, metastasis status, status, and survival months) for patients with sarcoma were downloaded from TCGA database (https://www.cancer.gov/). Patients with sarcomas without related overall survival were excluded. Gene expression datasets of normal muscle and adipose tissue samples were downloaded from the UCSC Xena database (https://xenabrowser.net/). To achieve comparability between gene expression data, we converted gene expression datasets of UCSC from Fragments Per Kilobase Million (FPKM) format to transcripts per kilobase million (TPM) format. Genome mutation data (CNV) of TCGA-SCAR were also downloaded from the UCSC database. By searching the literature related to m6A methylation modification, 23 confirmed m6A regulators were included in our study [7, 33, 34]. We downloaded the gene file of “c2.cp.kegg.v7.4.symbols.gmt” from the Molecular Signatures Database (MSigDB) for GSVA analysis. The 23 m6A regulators included 13 readers, 8 writers, and 2 erasers (Supplementary Table 1).
Data collection for validation
We obtained gene expression profiles and clinical data for an independent cohort, GSE63157, from the Gene Expression Omnibus (GEO) database (https://www.ncbi.nlm.nih.gov/geo/). GSE63157 was used as an external validation cohort. We collected STS patients admitted to the Tianjin Medical University Cancer Institute and Hospital between 2016 and 2019. Tissue specimens from all patients were reviewed by pathologists and diagnosed with STS. All patients underwent whole-exome sequencing (WES). We quantified the scores of 10 immune cell types from the RNA-seq data of the six samples. The retrospective investigation was conducted in accordance with the Declaration of Helsinki and approved by the Ethics Committee of Tianjin Medical University Cancer Institute and Hospital (Approval No. E2019144). All patients provided signed informed consent. Genetic sequencing data were obtained from the tissue samples of six patients (the trial registration was NCT04126993) [35]. The Yuce Bio Company conducted gene sequencing procedures. Genomic DNA from formalin-fixed, paraffin-embedded (FFPE) sections from biopsy samples or whole blood control samples were extracted using the Gene Read DNA FFPE Kit (Qiagen, Germantown, MD, USA) and the Mag-Bind Blood and Tissue DNA HDQ 96 Kit (Qiagen), respectively. Library preparations were performed using the KAPA Library Quantification Kit (Roche, Indianapolis, IN, USA), and target enrichment was performed using the Target Seq Enrichment Kit (iGene Tech, Beijing, China), and sequencing was performed on a NovaSeq (Illumina, San Diego, CA, USA). The raw reads of WES-seq were processed using SOAPnuke (version 1.5.6, parameters: -l 20 -q 0.1 -n 0.1) to remove ambiguous reads and/or low-quality reads. These qualified sequence reads were then aligned to the human reference genome (UCSC hg38) using BWA-mem (BWA, version 0.7.12). We quantified the scores of 10 immune cell types from the RNA-seq data of the six samples.
CNV analysis and differential analysis of m6A regulators and establishment of m6A regulator network
To explore the extent of mutation of 23 m6A regulators in sarcoma, we performed CNV analysis and labeled the positions of 23 m6A regulators in human chromosomes. Gene Ontology (GO) enrichment analysis based on 23 m6A regulators was performed. Combined with the datasets of sarcoma samples in TCGA and the datasets of muscle and adipose tissues in UCSC, we performed differential analysis. Immediately afterward, we combined the survival data of patients with sarcoma with K-M analysis for each m6A regulator and explored the interrelationships between the m6A regulators. Based on the results of the above analysis, an m6A regulator network was established.
Consistent cluster analysis of 23 m6A regulators
NMF consensus clustering adds non-negative constraints to the decomposed matrix based on matrix factorization. For example, matrix A (MA) is decomposed into two non-negative matrices B (MB) and C (MC) (i.e., MA ≈ MB × MC, MB ≥ 0, MC ≥ 0) [36]. NMF consensus clustering was applied to identify different m6A regulator expression patterns by the “ConsensusClusterPlus” package, and we named the m6A regulator expression pattern the m6A cluster. The selection of the optimal number of clusters was determined by the cophenetic, consensus index, and silhouette coefficients. According to the consensus clustering results, we performed K-M analysis and plotted a heat map of patients in different m6A clusters.
GSVA
GSVA is a non-parametric unsupervised analysis method that assesses whether different metabolic pathways are enriched among different clusters by combining the analysis of differences in gene expression between clusters [37]. We analyze the differences in biological processes between four different m6A regulator expression patterns by the “GSVA” package. Adjusted P-values less than 0.05, and log fold change (log FC) less than 0.1 were considered statistically significant.
Estimation of immune cell infiltration and Principal Component Analysis (PCA)
The enrichment score calculated by single-sample gene set enrichment analysis (ssGSEA) represents the relative abundance of each immune cell in each m6A cluster [38]. PCA uses the idea of dimensionality reduction to transform K dimensions into M dimensions (K > M) with a small loss of information and uses M dimensions to explain the variance-covariance structure of multiple variables, thereby simplifying the system structure [39]. In our study, the N dimensions represent 23 m6A modulators, and the K dimensions represent two dimensions, which can be visualized. At the same time, we used different colors to distinguish the different m6A clusters.
Establishment of m6A gene clusters and m6A score
We then established different m6A gene clusters to analyze the m6A DEGs. The process is as follows: (I) Analysis of differential genes using unsupervised clustering; (II) The number and stability of gene clusters were also defined by the consensus clustering algorithm. Based on the results of the m6A gene clusters, we performed a K-M analysis. Furthermore, to further quantify the m6A methylation modification in patients with sarcoma, we constructed a novel scoring system using prognosis-related m6A DEGs and named it the m6A score. The m6A score was constructed as follows: (I) We performed PCA and extracted the principal components 1 and 2 (PC1 and PC2); (II) Calculate the m6A score using the following equation:
where i is the prognosis-related m6A DEGs.
Based on optimal cut-off points, patients with sarcoma were separated into high- and low m6A score groups. To further verify the m6A score, we used the Kruskal-Wallis test to evaluate whether the m6A score was different in the m6A cluster and the m6A gene cluster. To further demonstrate the characteristics of the m6A score, we assessed the survival status between high- and low-m6A score groups by K-M analysis. We also assessed survival status in different clinicopathological characteristics, including age (≤65, >65 years), race (white and others [Asian, black, and African American]), sex (female and male), site (soft tissues and parts other than soft tissues [uterus and retroperitoneum, etc.]), margin status (R0 and R1/2), and metastasis status (yes and no/unknown), according to high- and low-m6A score groups. To further explore the predictive function of the m6A score for patients with sarcoma, we drew the receiver operating characteristic curve (ROC) and calculated the area under the curve (AUC) for the m6A score and the different clinicopathological characteristics. To further test the accuracy of the m6A score, we calculated the m6A score values of the independent cohort (GSE63157) and plotted the ROC curve and K-M analysis.
Correlation between m6A score and tumor immune microenvironment
First, we analyzed the differences in ICI-related biomarkers (CTLA-4, PD-1/PD-L1, hepatitis A virus cellular receptor 2/T cell immunoglobulin domain and mucin domain-3 [HAVCR2/TIM-3], lymphocyte activation gene 3 [LAG3], and T cell immunoreceptor with immunoglobulin and ITIM domain [TIGIT]) between the high- and low-m6A score groups. Second, we used the CIBERSORT database to identify a complex association between 22 different immune cells and different m6A score groups [41]. Third, TIMER [42] (https://cistrome.shinyapps.io/timer/) was used to systematically analyze and estimate the abundance of the six immune cell immune infiltrates in the m6A score. Finally, we used the set GSE63157 from GEO and six samples from Tianjin Medical University Cancer Institute and Hospital to verify the relationship between the m6A score and TIME.
Statistical analyses
Statistical analyses in this study were performed using Ri386-4.0.3. Differences in quantitative data and normally distributed variables were compared using the t-test, and differences in non-normally distributed variables were compared using the Wilcoxon rank-sum test. Differences were compared for more than two groups of variables using one-way analysis of variance and the Kruskal-Wallis test. Prognostic analysis was performed using the Kaplan-Meier survival analysis and Cox proportional hazards model. Pearson’s analysis was used for the correlation analysis. A P-value <0.05 (two-tailed) was considered to indicate statistical significance. The Benjamini-Hochberg method was used to control for FDR for multiple hypothesis testing.
Ethics approval and consent to participate
TCGA, UCSC, and GEO data did not involve animal experiments, human specimens, or ethics-related issues. Ethical approval for the six patients was obtained from the research ethics committee of the Cancer Institute and Hospital of Tianjin Medical University prior to the study. Written informed consent was obtained from all patients and/or their families. All specimens were handled and stored anonymously according to ethical and legal standards.
Supplementary Materials
Author Contributions
All authors contributed to the planning and design of the study. Z.H.L., J.Q.W. and H.H.Z. were involved in review of the raw data and directly involved in the analysis. Z.H.L., J.Q.W. and C.Z. provided analytical feedback based on aggregated results. Z.H.L. and J.Q.W. drafted the manuscript, with input from all authors. Z.H.L. was responsible for the chart making. All authors provided substantive review and commentary on multiple drafts and approved the final version. Y.J. and J.L.Y. supervised the study.
Acknowledgments
We are very grateful for the contributions of TCGA, UCSC, and GEO databases that provide information on cancer research, as well as all colleagues involved in the study.
Conflicts of Interest
The authors declare no conflicts of interest related to this study.
References
- 1. Li J, Yang X, Qi Z, Sang Y, Liu Y, Xu B, Liu W, Xu Z, Deng Y. The role of mRNA m6A methylation in the nervous system. Cell Biosci. 2019; 9:66. https://doi.org/10.1186/s13578-019-0330-y [PubMed]
- 2. Chen M, Nie ZY, Wen XH, Gao YH, Cao H, Zhang SF. m6A RNA methylation regulators can contribute to malignant progression and impact the prognosis of bladder cancer. Biosci Rep. 2019; 39:BSR20192892. https://doi.org/10.1042/BSR20192892 [PubMed]
- 3. Yue Y, Liu J, He C. RNA N6-methyladenosine methylation in post-transcriptional gene expression regulation. Genes Dev. 2015; 29:1343–55. https://doi.org/10.1101/gad.262766.115 [PubMed]
- 4. Jia G, Fu Y, He C. Reversible RNA adenosine methylation in biological regulation. Trends Genet. 2013; 29:108–15. https://doi.org/10.1016/j.tig.2012.11.003 [PubMed]
- 5. Chen XY, Zhang J, Zhu JS. The role of m6A RNA methylation in human cancer. Mol Cancer. 2019; 18:103. https://doi.org/10.1186/s12943-019-1033-z [PubMed]
- 6. Pan Y, Ma P, Liu Y, Li W, Shu Y. Multiple functions of m6A RNA methylation in cancer. J Hematol Oncol. 2018; 11:48. https://doi.org/10.1186/s13045-018-0590-8 [PubMed]
- 7. Zhang B, Wu Q, Li B, Wang D, Wang L, Zhou YL. m6A regulator-mediated methylation modification patterns and tumor microenvironment infiltration characterization in gastric cancer. Mol Cancer. 2020; 19:53. https://doi.org/10.1186/s12943-020-01170-0 [PubMed]
- 8. Siegel RL, Miller KD, Fuchs HE, Jemal A. Cancer Statistics, 2021. CA Cancer J Clin. 2021; 71:7–33. https://doi.org/10.3322/caac.21654 [PubMed]
- 9. Deng J, Zeng W, Kong W, Shi Y, Mou X. The Study of Sarcoma Microenvironment Heterogeneity Associated With Prognosis Based on an Immunogenomic Landscape Analysis. Front Bioeng Biotechnol. 2020; 8:1003. https://doi.org/10.3389/fbioe.2020.01003 [PubMed]
- 10. Dai D, Xie L, Shui Y, Li J, Wei Q. Identification of Tumor Microenvironment-Related Prognostic Genes in Sarcoma. Front Genet. 2021; 12:620705. https://doi.org/10.3389/fgene.2021.620705 [PubMed]
- 11. Gajewski TF, Schreiber H, Fu YX. Innate and adaptive immune cells in the tumor microenvironment. Nat Immunol. 2013; 14:1014–22. https://doi.org/10.1038/ni.2703 [PubMed]
- 12. Fridman WH, Zitvogel L, Sautès-Fridman C, Kroemer G. The immune contexture in cancer prognosis and treatment. Nat Rev Clin Oncol. 2017; 14:717–34. https://doi.org/10.1038/nrclinonc.2017.101 [PubMed]
- 13. Zuo W, Zhao L. Recent advances and application of PD-1 blockade in sarcoma. Onco Targets Ther. 2019; 12:6887–96. https://doi.org/10.2147/OTT.S220045 [PubMed]
- 14. Groisberg R, Hong DS, Behrang A, Hess K, Janku F, Piha-Paul S, Naing A, Fu S, Benjamin R, Patel S, Somaiah N, Conley A, Meric-Bernstam F, Subbiah V. Characteristics and outcomes of patients with advanced sarcoma enrolled in early phase immunotherapy trials. J Immunother Cancer. 2017; 5:100. https://doi.org/10.1186/s40425-017-0301-y [PubMed]
- 15. Starzer AM, Berghoff AS, Hamacher R, Tomasich E, Feldmann K, Hatziioannou T, Traint S, Lamm W, Noebauer-Huhmann IM, Furtner J, Müllauer L, Amann G, Bauer S, et al. Tumor DNA methylation profiles correlate with response to anti-PD-1 immune checkpoint inhibitor monotherapy in sarcoma patients. J Immunother Cancer. 2021; 9:e001458. https://doi.org/10.1136/jitc-2020-001458 [PubMed]
- 16. Chen X, Chen H, He D, Cheng Y, Zhu Y, Xiao M, Lan H, Wang Z, Cao K. Analysis of Tumor Microenvironment Characteristics in Bladder Cancer: Implications for Immune Checkpoint Inhibitor Therapy. Front Immunol. 2021; 12:672158. https://doi.org/10.3389/fimmu.2021.672158 [PubMed]
- 17. Jin Y, Wang Z, He D, Zhu Y, Hu X, Gong L, Xiao M, Chen X, Cheng Y, Cao K. Analysis of m6A-Related Signatures in the Tumor Immune Microenvironment and Identification of Clinical Prognostic Regulators in Adrenocortical Carcinoma. Front Immunol. 2021; 12:637933. https://doi.org/10.3389/fimmu.2021.637933 [PubMed]
- 18. Lin S, Xu H, Zhang A, Ni Y, Xu Y, Meng T, Wang M, Lou M. Prognosis Analysis and Validation of m6A Signature and Tumor Immune Microenvironment in Glioma. Front Oncol. 2020; 10:541401. https://doi.org/10.3389/fonc.2020.541401 [PubMed]
- 19. Liu X, Xiao M, Zhang L, Li L, Zhu G, Shen E, Lv M, Lu X, Sun Z. The m6A methyltransferase METTL14 inhibits the proliferation, migration, and invasion of gastric cancer by regulating the PI3K/AKT/mTOR signaling pathway. J Clin Lab Anal. 2021; 35:e23655. https://doi.org/10.1002/jcla.23655 [PubMed]
- 20. Li B, Zhu L, Lu C, Wang C, Wang H, Jin H, Ma X, Cheng Z, Yu C, Wang S, Zuo Q, Zhou Y, Wang J, et al. circNDUFB2 inhibits non-small cell lung cancer progression via destabilizing IGF2BPs and activating anti-tumor immunity. Nat Commun. 2021; 12:295. https://doi.org/10.1038/s41467-020-20527-z [PubMed]
- 21. Xu X, Huang J, Ocansey DKW, Xia Y, Zhao Z, Xu Z, Yan Y, Zhang X, Mao F. The Emerging Clinical Application of m6A RNA Modification in Inflammatory Bowel Disease and Its Associated Colorectal Cancer. J Inflamm Res. 2021; 14:3289–306. https://doi.org/10.2147/JIR.S320449 [PubMed]
- 22. Chong W, Shang L, Liu J, Fang Z, Du F, Wu H, Liu Y, Wang Z, Chen Y, Jia S, Chen L, Li L, Chen H. m6A regulator-based methylation modification patterns characterized by distinct tumor microenvironment immune profiles in colon cancer. Theranostics. 2021; 11:2201–17. https://doi.org/10.7150/thno.52717 [PubMed]
- 23. Shulman Z, Stern-Ginossar N. The RNA modification N6-methyladenosine as a novel regulator of the immune system. Nat Immunol. 2020; 21:501–12. https://doi.org/10.1038/s41590-020-0650-4 [PubMed]
- 24. Wang S, Sun C, Li J, Zhang E, Ma Z, Xu W, Li H, Qiu M, Xu Y, Xia W, Xu L, Yin R. Roles of RNA methylation by means of N6-methyladenosine (m6A) in human cancers. Cancer Lett. 2017; 408:112–20. https://doi.org/10.1016/j.canlet.2017.08.030 [PubMed]
- 25. Fan L, Lin Y, Lei H, Shu G, He L, Yan Z, Rihan H, Yin G. A newly defined risk signature, consisting of three m6A RNA methylation regulators, predicts the prognosis of ovarian cancer. Aging (Albany NY). 2020; 12:18453–75. https://doi.org/10.18632/aging.103811 [PubMed]
- 26. El Hassouni B, Granchi C, Vallés-Martí A, Supadmanaba IGP, Bononi G, Tuccinardi T, Funel N, Jimenez CR, Peters GJ, Giovannetti E, Minutolo F. The dichotomous role of the glycolytic metabolism pathway in cancer metastasis: Interplay with the complex tumor microenvironment and novel therapeutic strategies. Semin Cancer Biol. 2020; 60:238–48. https://doi.org/10.1016/j.semcancer.2019.08.025 [PubMed]
- 27. Jiang Z, Liu Z, Li M, Chen C, Wang X. Increased glycolysis correlates with elevated immune activity in tumor immune microenvironment. EBioMedicine. 2019; 42:431–42. https://doi.org/10.1016/j.ebiom.2019.03.068 [PubMed]
- 28. Pan XB, Lu Y, Huang JL, Long Y, Yao DS. Prognostic genes in the tumor microenvironment in cervical squamous cell carcinoma. Aging (Albany NY). 2019; 11:10154–66. https://doi.org/10.18632/aging.102429 [PubMed]
- 29. Zhou R, Zhang J, Zeng D, Sun H, Rong X, Shi M, Bin J, Liao Y, Liao W. Immune cell infiltration as a biomarker for the diagnosis and prognosis of stage I-III colon cancer. Cancer Immunol Immunother. 2019; 68:433–42. https://doi.org/10.1007/s00262-018-2289-7 [PubMed]
- 30. Liu Z, McMichael EL, Shayan G, Li J, Chen K, Srivastava R, Kane LP, Lu B, Ferris RL. Novel Effector Phenotype of Tim-3+ Regulatory T Cells Leads to Enhanced Suppressive Function in Head and Neck Cancer Patients. Clin Cancer Res. 2018; 24:4529–38. https://doi.org/10.1158/1078-0432.CCR-17-1350 [PubMed]
- 31. Sun QY, Qu CH, Liu JQ, Zhang P, Yao J. Down-regulated expression of Tim-3 promotes invasion and metastasis of colorectal cancer cells. Neoplasma. 2017; 64:101–7. https://doi.org/10.4149/neo_2017_112 [PubMed]
- 32. Pu F, Chen F, Zhang Z, Qing X, Lin H, Zhao L, Xia P, Shao Z. TIM-3 expression and its association with overall survival in primary osteosarcoma. Oncol Lett. 2019; 18:5294–300. https://doi.org/10.3892/ol.2019.10855 [PubMed]
- 33. Li K, Luo H, Luo H, Zhu X. Clinical and prognostic pan-cancer analysis of m6A RNA methylation regulators in four types of endocrine system tumors. Aging (Albany NY). 2020; 12:23931–44. https://doi.org/10.18632/aging.104064 [PubMed]
- 34. Zhang B, Gu Y, Jiang G. Expression and Prognostic Characteristics of m6 A RNA Methylation Regulators in Breast Cancer. Front Genet. 2020; 11:604597. https://doi.org/10.3389/fgene.2020.604597 [PubMed]
- 35. Lu J, Li T, Liao Z, Yu H, Zhao Y, Wu H, Ren Z, Zhao J, Xing R, Teng S, Yang Y, Li X, Chen K, et al. The efficacies and biomarker investigations of antiprogrammed death-1 (anti-PD-1)-based therapies for metastatic bone and soft tissue sarcoma. Cancer Biol Med. 2021. [Epub ahead of print]. https://doi.org/10.20892/j.issn.2095-3941.2021.0270 [PubMed]
- 36. Zhang ZY, Sun KD, Wang SQ. Enhanced community structure detection in complex networks with partial background information. Sci Rep. 2013; 3:3241. https://doi.org/10.1038/srep03241 [PubMed]
- 37. Hänzelmann S, Castelo R, Guinney J. GSVA: gene set variation analysis for microarray and RNA-seq data. BMC Bioinformatics. 2013; 14:7. https://doi.org/10.1186/1471-2105-14-7 [PubMed]
- 38. Hou C, Cai H, Zhu Y, Huang S, Song F, Hou J. Development and Validation of Autophagy-Related Gene Signature and Nomogram for Predicting Survival in Oral Squamous Cell Carcinoma. Front Oncol. 2020; 10:558596. https://doi.org/10.3389/fonc.2020.558596 [PubMed]
- 39. Hadizadeh Esfahani A, Sverchkova A, Saez-Rodriguez J, Schuppert AA, Brehme M. A systematic atlas of chaperome deregulation topologies across the human cancer landscape. PLoS Comput Biol. 2018; 14:e1005890. https://doi.org/10.1371/journal.pcbi.1005890 [PubMed]
- 40. Bardou P, Mariette J, Escudié F, Djemiel C, Klopp C. jvenn: an interactive Venn diagram viewer. BMC Bioinformatics. 2014; 15:293. https://doi.org/10.1186/1471-2105-15-293 [PubMed]
- 41. Nie H, Qiu J, Wen S, Zhou W. Combining Bioinformatics Techniques to Study the Key Immune-Related Genes in Abdominal Aortic Aneurysm. Front Genet. 2020; 11:579215. https://doi.org/10.3389/fgene.2020.579215 [PubMed]
- 42. Li T, Fan J, Wang B, Traugh N, Chen Q, Liu JS, Li B, Liu XS. TIMER: A Web Server for Comprehensive Analysis of Tumor-Infiltrating Immune Cells. Cancer Res. 2017; 77:e108–10. https://doi.org/10.1158/0008-5472.CAN-17-0307 [PubMed]