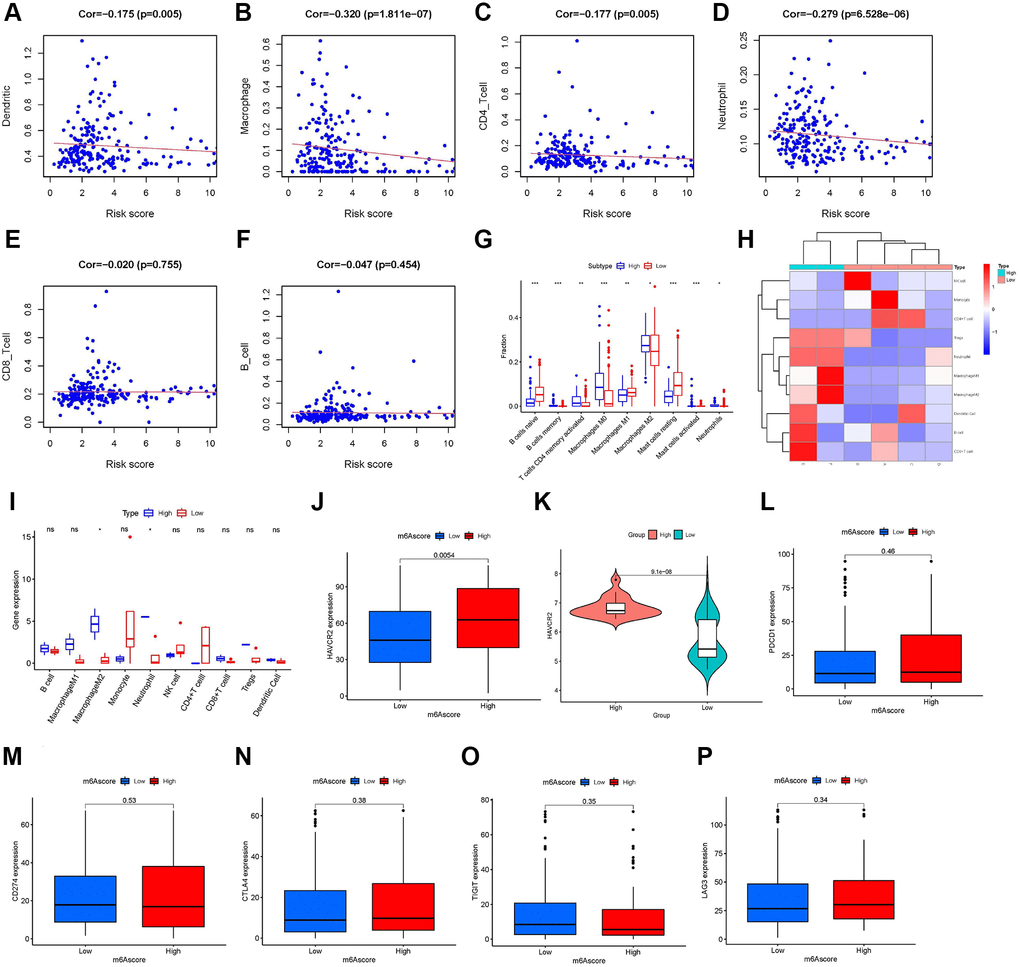
Figure 7.Role of the m6A score in immunotherapy. Infiltration abundances of six types of immune cells (Pearson correlation analysis). (A) Dendritic Cells (Cor = –0.175, P-value = 0.005). (B) Macrophages (Cor = –0.320, P-value <0.001). (C) CD4+ T cells (Cor = –0.177, P-value = 0.005). (D) Neutrophil (Cor = –0.279, P-value <0.001). (E) CD8+ T cells (Cor = –0.020, P-value = 0.755). and (F) B cells (Cor = –0.047, P-value = 0.454). (G) Box plots visualizing significantly different immune cells between high- and low-m6A score groups. Infiltration degrees of naive B cells, M1 macrophages, and resting mast cells were higher in the low-m6A score group than the high-m6A score group. Meanwhile, the infiltration degrees of memory B cells, activated memory CD4 T cells, M0 and M2 macrophages, and activated mast cells were higher in the high-m6A score group than the low-m6A score group. (H) Ten immune cells infiltration heat map of the six patients from Tianjin Medical University Cancer Institute and Hospital. (I) Infiltration degrees of M2 macrophages and neutrophils were higher in the high-m6A score group than the low-m6A score group in the six patients validation set. The box plot shows the differences in (J) hepatitis A virus cellular receptor 2 (HAVCR2) between high- and low-m6A score groups in TCGA database, (K) HAVCR2 between high- and low-m6A score groups in the validation set, GSE63157, and (L) programmed cell death 1 (PD-1), (M) CD274, (N) cytotoxic T lymphocyte-associated antigen-4 (CTLA-4), (O) T cell immunoglobulin and ITIM domain (TIGIT), and (P) lymphocyte activation gene-3 (LAG3) between high- and low-m6A score groups in The Cancer Genome Atlas (TCGA) database. Asterisks represent the statistical P-values (*P-value <0.05; **P-value <0.01; ***P-value <0.001).