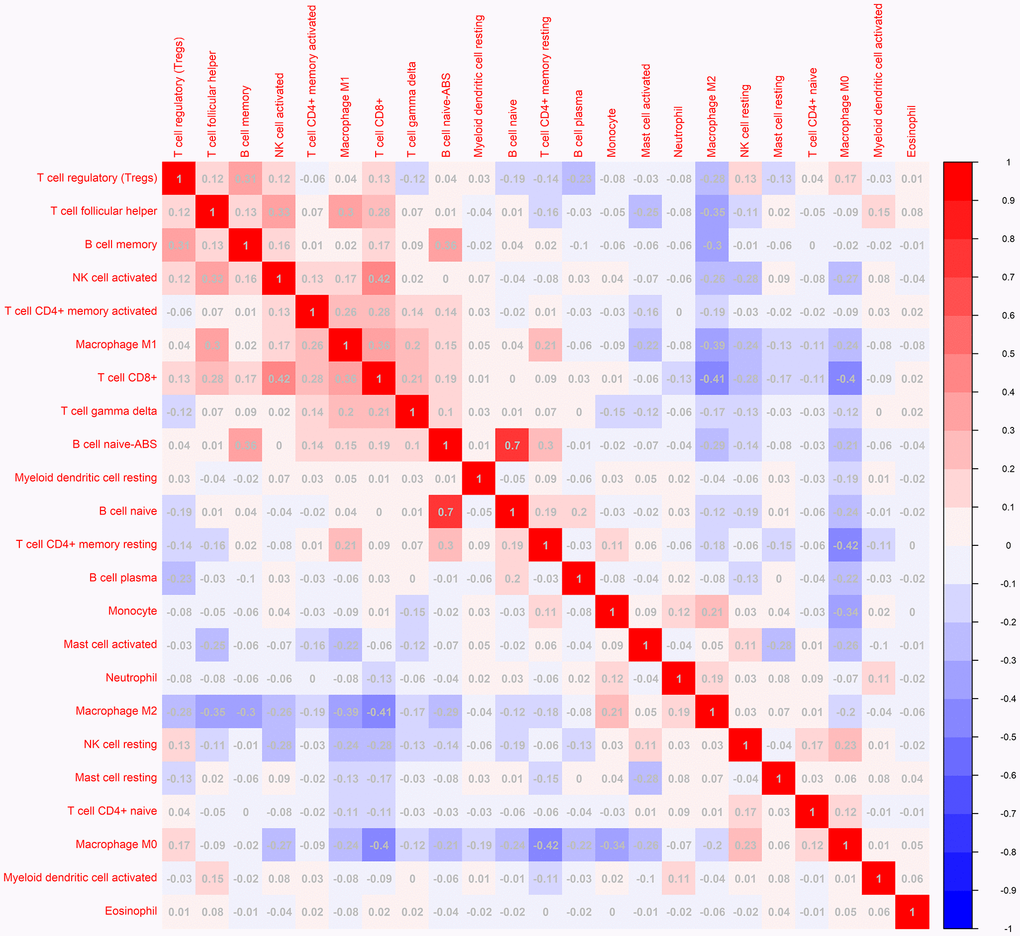
Figure 4.The correlation matrix of 23 kinds of TLLs for breast cancer samples. The relationship between the abundance ratios of various immune cells. The value represents the correlation value. Red represents a positive correlation, and the blue represents a negative correlation.