


Introduction
Breast cancer has become the most common and most prevalent tumor among women worldwide. The incidence rate of breast cancer is increasing, and the incidence rate of death is decreasing. Although oncologists have conducted extensive and in-depth studies on the causes of breast cancer, the exact pathogenesis is unclear, and targeted prevention and treatment are difficult [1–3]. The presence of tumor specific immune responses in breast cancer has been suppressed, even in the early stages of cancer development. The microenvironment that inhibits the body’s immunity plays an important role in this process, which may be related to its effect on tumor antigen-specific immune cells [4–6]. The design of therapeutic regimen against immunosuppressive microenvironment is a new strategy for breast cancer immunotherapy. However, the molecular mechanism of immune suppression in the microenvironment of breast cancer is still unclear, which limits the development of specific targeted therapy [7–10].
Tumor microenvironment is a special microenvironment for tumor cells to survive and develop [11]. It is a complex whole composed of a variety of cells and extracellular matrix that affect the occurrence, development, invasion and metastasis of tumor. These components are collectively referred to as tumor microenvironment. In terms of its broad components, tumor microenvironment includes endothelial cells and their precursors, tumor associated fibroblasts, T lymphocytes, B lymphocytes, natural killer cells, antigen presenting cells (such as macrophages, dendritic cells), tumor associated macrophages, and extracellular matrix [12–14].
Tumor cell immune escape is one of the important characteristics of tumor, and it is also the main reason for the poor effect of conventional treatment. Human immunity, especially cellular immunity, is closely related to the occurrence and development of tumor. Tumor immune escape is a multi-link and multi-mechanism process, such as the immune modification of tumor cells, the immune tolerance of tumor patients and the decrease of tumor microenvironment immune function. Tumor microenvironment is a kind of microenvironment composed of a variety of stromal cells and cytokines around tumor cells, which is conducive to tumor growth. It is the first place for tumor antigen to contact with the body’s immune system, so it is of great significance in tumor immunology [15–18].
This study included 968 patients with breast cancer from the TCGA database. The ESTIMATE algorithm was used to evaluate the tumor microenvironment, and the matrix score and immune score of the tumor were obtained. According to the median score, the tumor was divided into two subgroups, high and low. The differentially expressed genes were screened for two subgroups related to the prognosis of patients, and go and KEGG enrichment analysis were performed for the obtained differentially expressed genes to explore their possible molecular functions, biological processes, cellular components of gene enrichment and signal pathways involved. For each of the differentially expressed genes, we drew the K-M survival curve, and screened out the differentially expressed genes significantly related to the five-year survival rate. In order to further explore the core regulatory genes, we constructed a protein interaction network for the survival related differentially expressed genes screened in the previous step, and carried out gene enrichment analysis and module mining. Finally, we screened the most significant prognostic related core differentially expressed genes from the differentially expressed genes.
Results
Workflow of TCGA- breast invasive carcinoma data processing
968 cases of breast cancer data were downloaded from TCGA-BRCA database, including mRNA sequencing data and corresponding clinical information. The data analysis scheme of this study is shown in Figure 1.
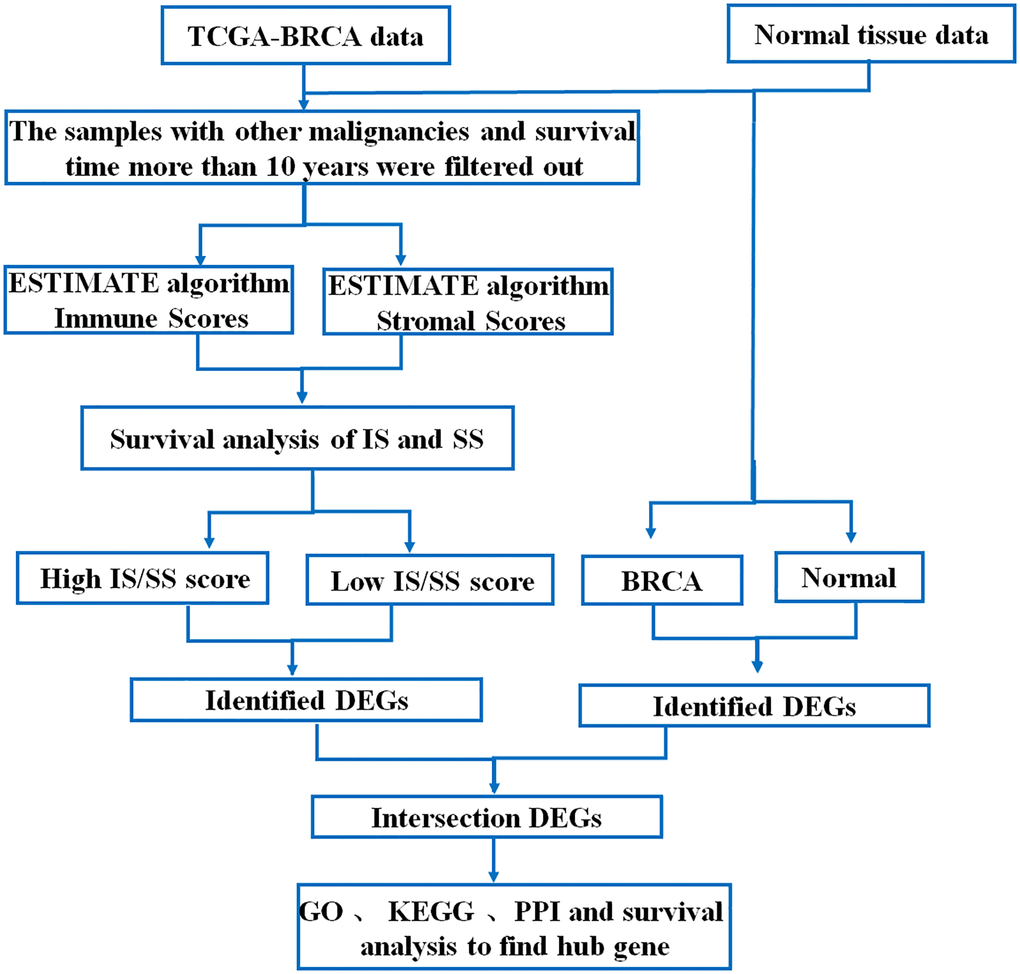
Figure 1. Flow chart of data processing in this study.
Low immune score is associated with poor prognosis in Breast invasive carcinoma
Immune score (IS) and stromal score (SS) in each 968 BRCA patients with complete clinical data were evaluated by ESTIMATE algorithm. BRCA patients were assigned to the high and low ARE/SS group, according to the median value of immune scores or stromal scores respectively. Kaplan-Meier curves showed that high immune score correlated with improved overall survival (OS) for BRCA (Figure 2A), while higher stromal score showed no significant benefits in OS (Figure 2B). Therefore, we focus on the genes associated with breast cancer prognosis and immune score. In addition, the immune scores were significantly associated with the subtype classification, including estrogen receptor status (Figure 2C), pathologic stage (Figure 2D), pathology M stage (Figure 2E), radiation therapy (Figure 2F).
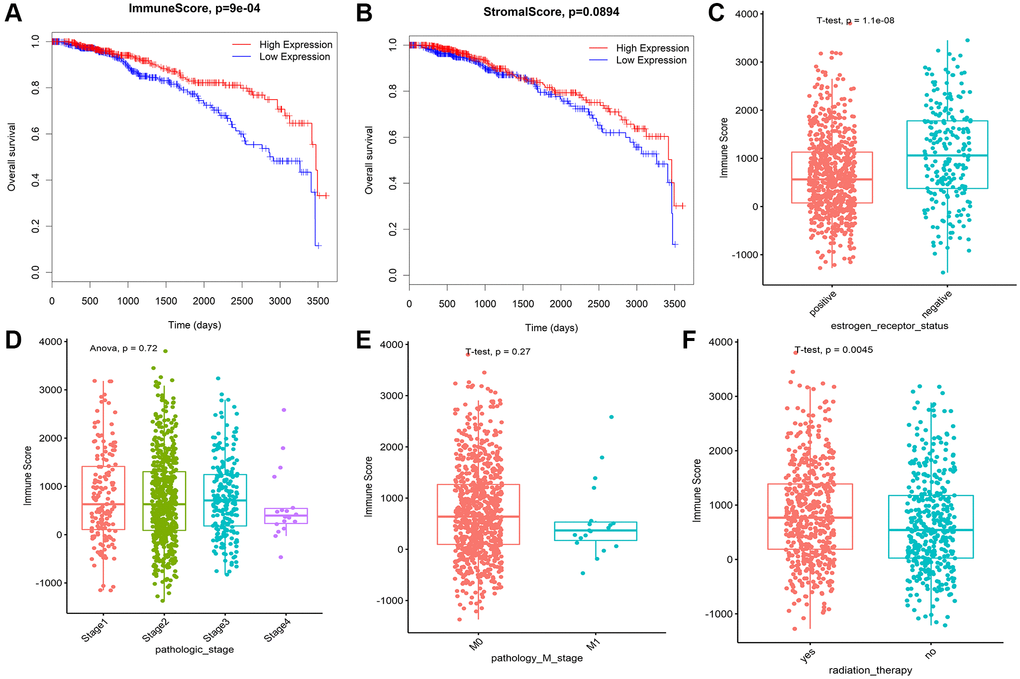
Figure 2. Immune conditions are associated with BRCA overall survival and clinical features. (A) Prognostic analysis of patients with differences in immune scores. (B) Prognostic analysis of patients with differences in stromal scores. (C) Correlation analysis between immune score and ER status of breast cancer. (D) The correlation between immune score and pathological stage of breast cancer was analyzed. (E) The correlation between immune score and M stage of breast cancer was analyzed. (F) The immune score was correlated with radiotherapy for breast cancer.
Composition of immune infiltration in breast invasive carcinoma patients
To investigate the landscape of immune infiltration in breast invasive carcinoma (BRCA), we estimated the immune infiltration level of each immune cell. The most important tumor-infiltrating lymphocytes (TIL) in breast cancer is macrophages, Mast cells activated and T lymphocytes. The higher proportion of B cell naïve, B cell plasma, Macrophage M0, Macrophage M2, Mast cells activated infiltration were found in low immune score group compared with the high immune score group, whereas proportion of T cell CD8+, T cell CD4+ memory resting, T cell follicular helper, Tregs, NK cell activated, Macrophage M1 cell infiltration were significantly higher in high immune score group (Figure 3). In addition, the correlation of 23 different TILs subsets was analyzed shown by the correlation heatmap (Figure 4). The populations with a significantly negative relation are Macrophage M0 and T cell CD4 memory resting (−0.42), Macrophage M2 and T cell CD8 (−0.41), Macrophage M0 and T cell CD4 (−0.4). The populations with a significantly positive relation were B cell naïve and B cell naïve-ABS (0.7); NK cells activated and T cell CD8; B cell naïve-ABS and B cell memory (0.36). These results suggest that the survival time of patients with high and low immune infiltration is significantly different.
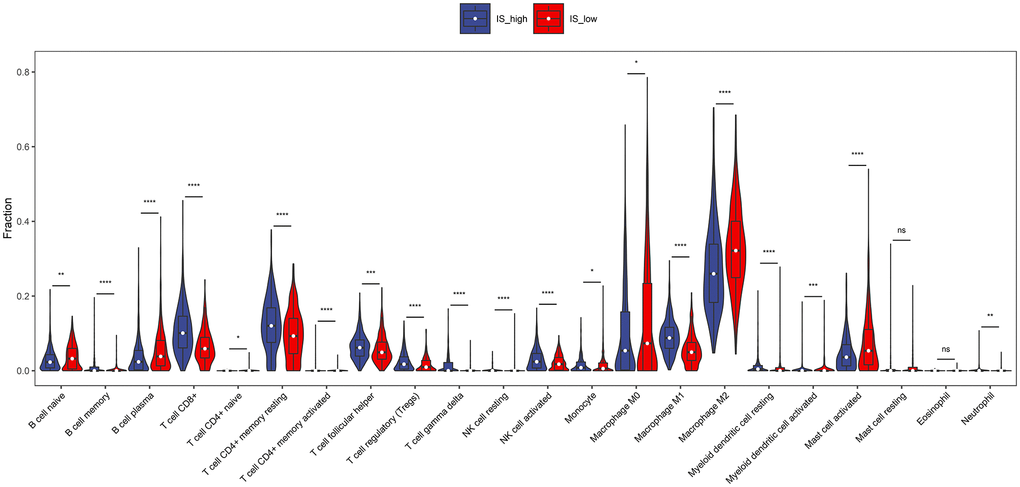
Figure 3. The proportions of TIICs between high immune score group and low immune score group. Difference of immune cell concentration between low-risk group and high-risk group. Red represents high-risk group while blue represents low-risk group.
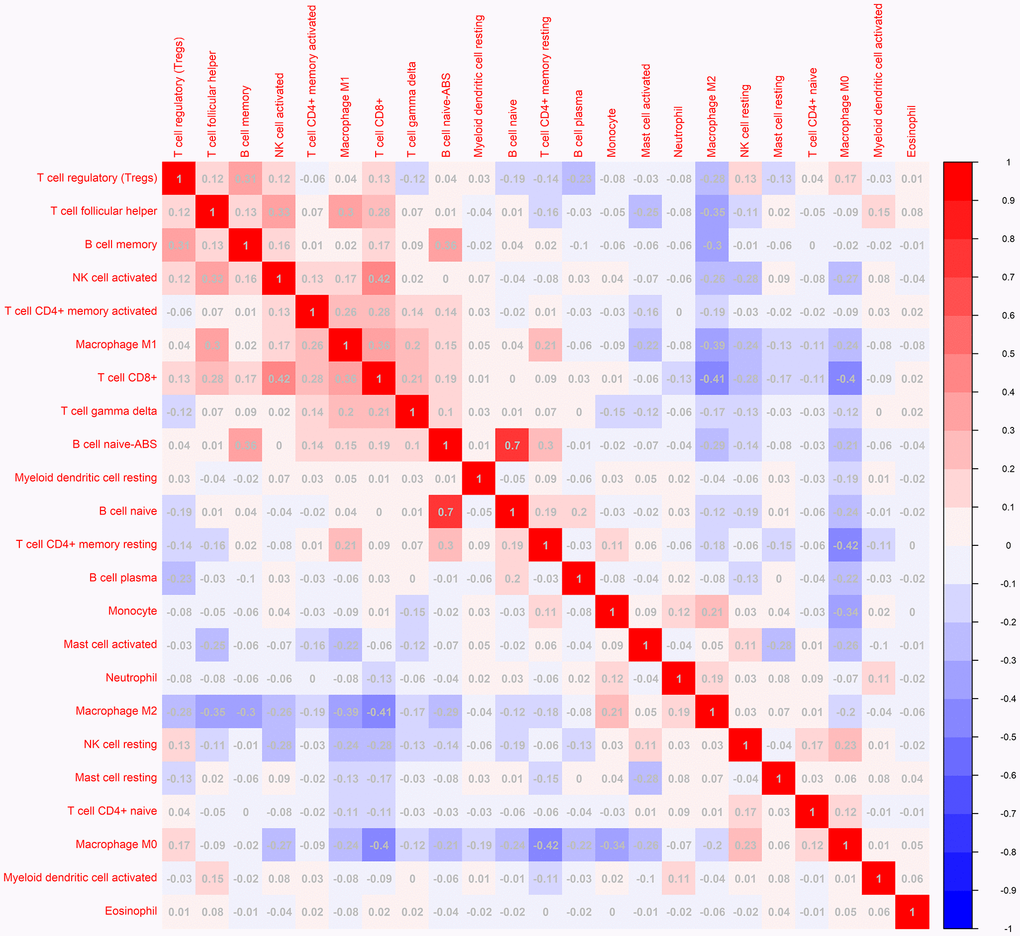
Figure 4. The correlation matrix of 23 kinds of TLLs for breast cancer samples. The relationship between the abundance ratios of various immune cells. The value represents the correlation value. Red represents a positive correlation, and the blue represents a negative correlation.
Identifying breast invasive carcinoma survival-related immune cells
According to the data of CIBERSORTx 22 kinds of immune cell infiltration degree, the samples were divided into high infiltration and low infiltration according to the median value of infiltration degree. Combined with the survival time of the samples, the survival analysis was carried out to find the immune cells with significant effect on survival and survival. Macrophage M1 and T cell CD8 cells were positively related to 5-year overall survival in patients with BRCA (Figure 5A–5C). However, Macrophage M2 was negatively related to 5-year overall survival (Figure 5B). There was no significant correlation between B cell plasma, T cell CD4+ memory activated, T cell follicular helper and the 5-year survival rate of breast cancer (Figure 5D–5F). It is worth noting that although the remaining immune cells are not statistically significant, there is a clear trend.
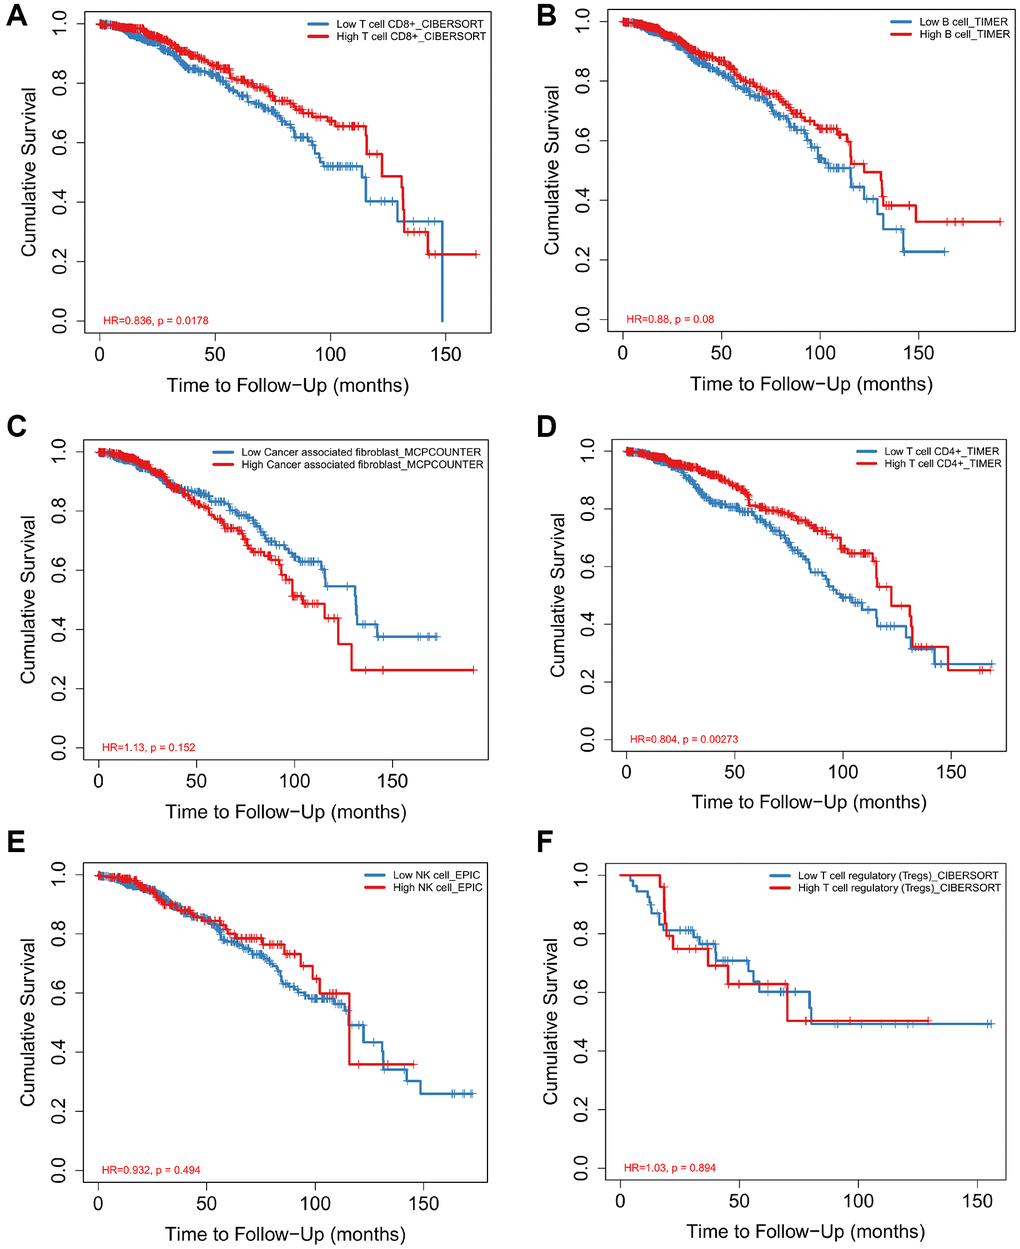
Figure 5. Analysis of immune cell proportion and survival time of breast cancer Survival curves for Macrophage M1 (A), Macrophage M2 (B), T cell CD8+ (C), B cell plasma (D), T cell follicular helper (E), T cell CD4+ memory activated (F) and prognosis of breast cancer were analyzed.
Differently expressed genes in high and low IS of breast invasive carcinoma
Differential gene expression was screened between the breast cancer high immune score group and the low immune score group with a difference of 2 and a significant threshold of P less than 0.05. A total of 959 differentially expressed genes were screened, including 659 up-regulated genes and 300 down regulated genes. (Figure 6A). Similarly, 900 significant differentially expressed genes were screened from breast cancer and normal tissues, of which 600 were up-regulated and 300 were down regulated (Figure 6B).
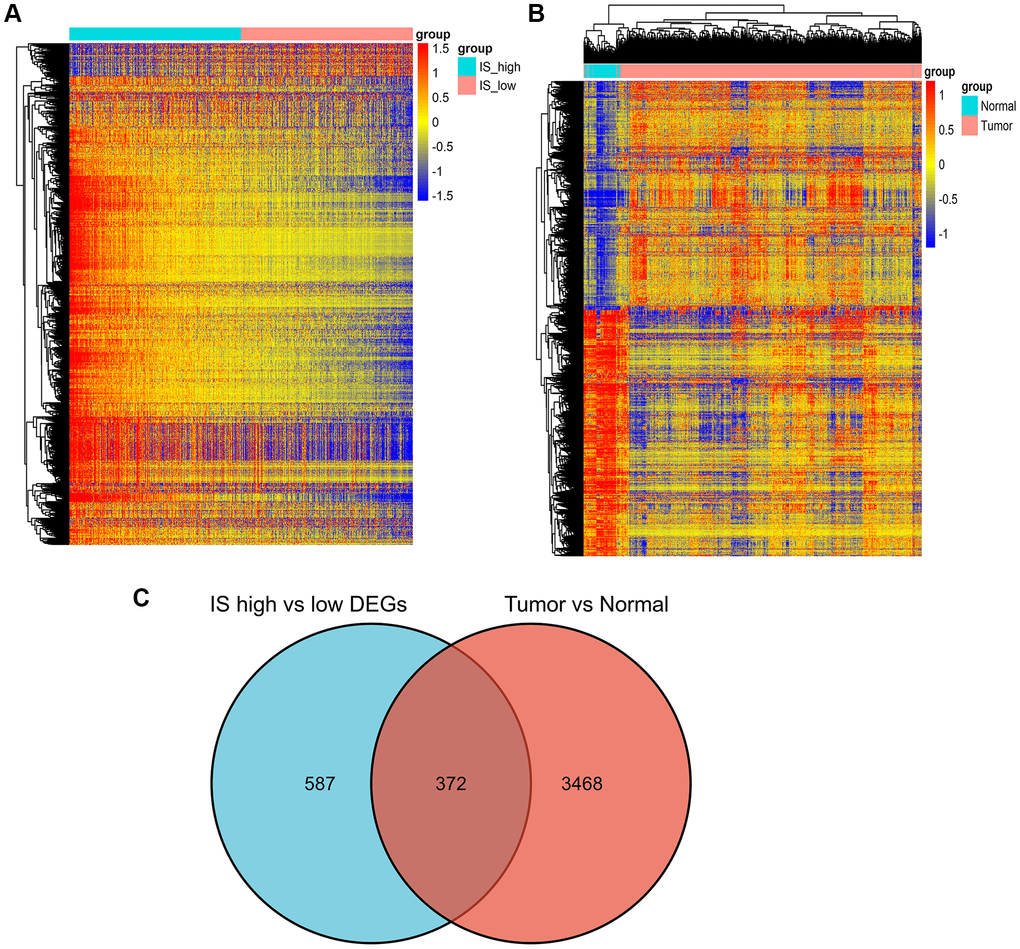
Figure 6. Screening of differently expressed genes. (A) Heatmap of DEGs for the high/low immune score groups. (B) Heatmap of DEGs for the BRCA/normal groups. (C) Commonly changed DEGs in the immune score and BRCA groups.
We identified 372 commonly differently expressed genes from the immune score and tumor groups (Figure 6C).
Enrichment analysis of immune-related genes
Subsequently, GO and KEGG enrichment analysis was performed on 372 differentially expressed genes. GO pathway enrichment showed those genes mainly enriched on immune response, adaptive immune response, innate immune response, B cell receptor signaling pathway, leukocyte migration, and inflammatory response (Figure 7A). We performed KEGG pathway enrichment and interrelation analysis. As shown in Figure 7B, enrichment of DEGs was mainly observed for the Cytokine-cytokine receptor interaction, Cell adhesion molecules, Staphylococcus aureus infection, Chemokine signaling pathway, Viral protein interaction with cytokine and cytokine receptor, Rheumatoid arthritis, Hematopoietic cell lineage.
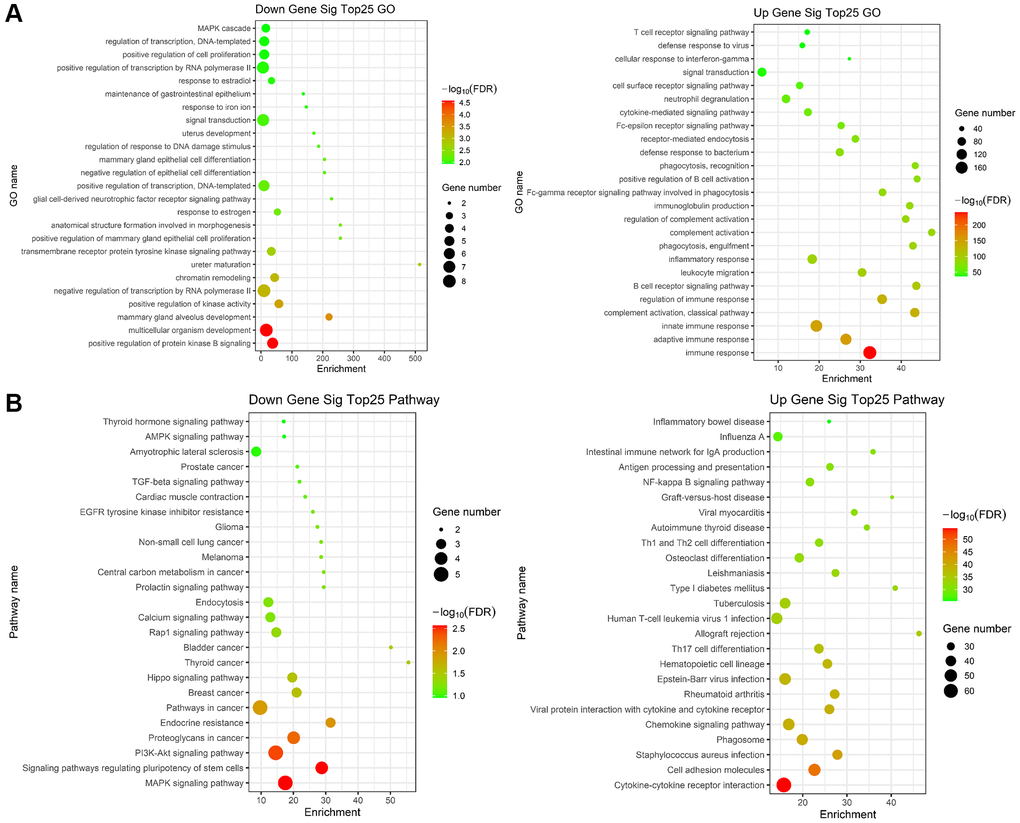
Figure 7. Gene ontology (GO) and KEGG term enrichment analysis of common DEGs. (A) The top 25 significantly enriched GO terms of down (left)/up (right) regulated genes. (B) The top 25 significantly KEGG of down (left)/up (right) regulated genes.
Protein-protein interaction (PPI) network construction and GSEA enrichment of hub genes
In order to further explore the interaction relationship of significant difference genes, the protein interaction network was constructed by using Cytoscape software. The protein interaction network of immune related differentially expressed genes is shown in Figure 8, which contains 75 nodes and 579 edges. The biological functions of immune related core differentially expressed genes were analyzed by GSEA. The results showed that immune related core differentially expressed genes were involved in response_ PD_ 1_ SIGNALING, REACTOME_ ADAPTIVE_ IMMUNE_ System and other biological processes.
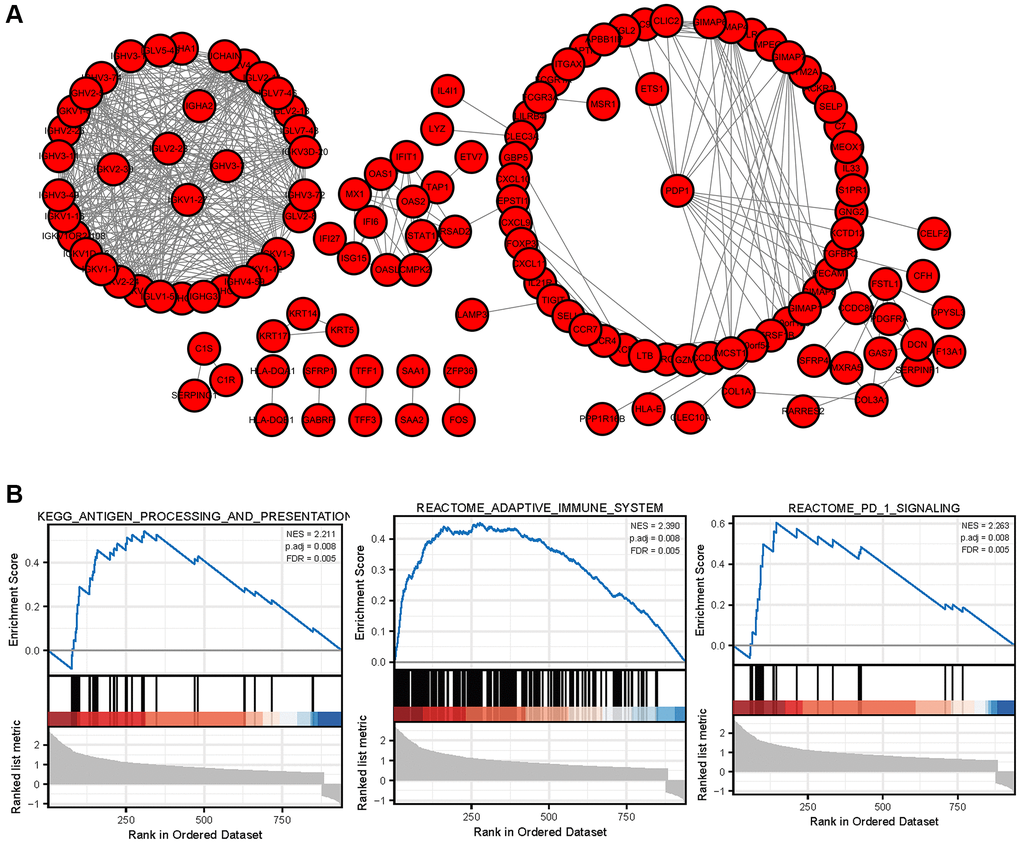
Figure 8. PPI network of DEGs and GSEA enrichment of hub genes (A) The protein interaction network of immune related differentially expressed genes in breast cancer. (B) GSEA enrichment analysis of breast cancer immune related core genes.
Survival analysis of hub genes in breast invasive carcinoma
Kaplan-Meier survival curves were constructed to determine the potential value of hub genes in predicting the overall survival of BRCA. Nine genes including CLEC3A, MCTS1, FOXP3, PDP1, TCP1, CXCL9, CCR5, CXCR3 and CD37 were closely related to the overall survival of BRCA. We also observed that the low expression of four genes (CLEC3A, MCTS1, PDP1 and TCP1,) was related to favorable survival outcomes. High expression of FOXP3, CXCL9, CCR5, CXCR3, and CD37 was related to a high overall survival rate in BRCA (Figure 9).
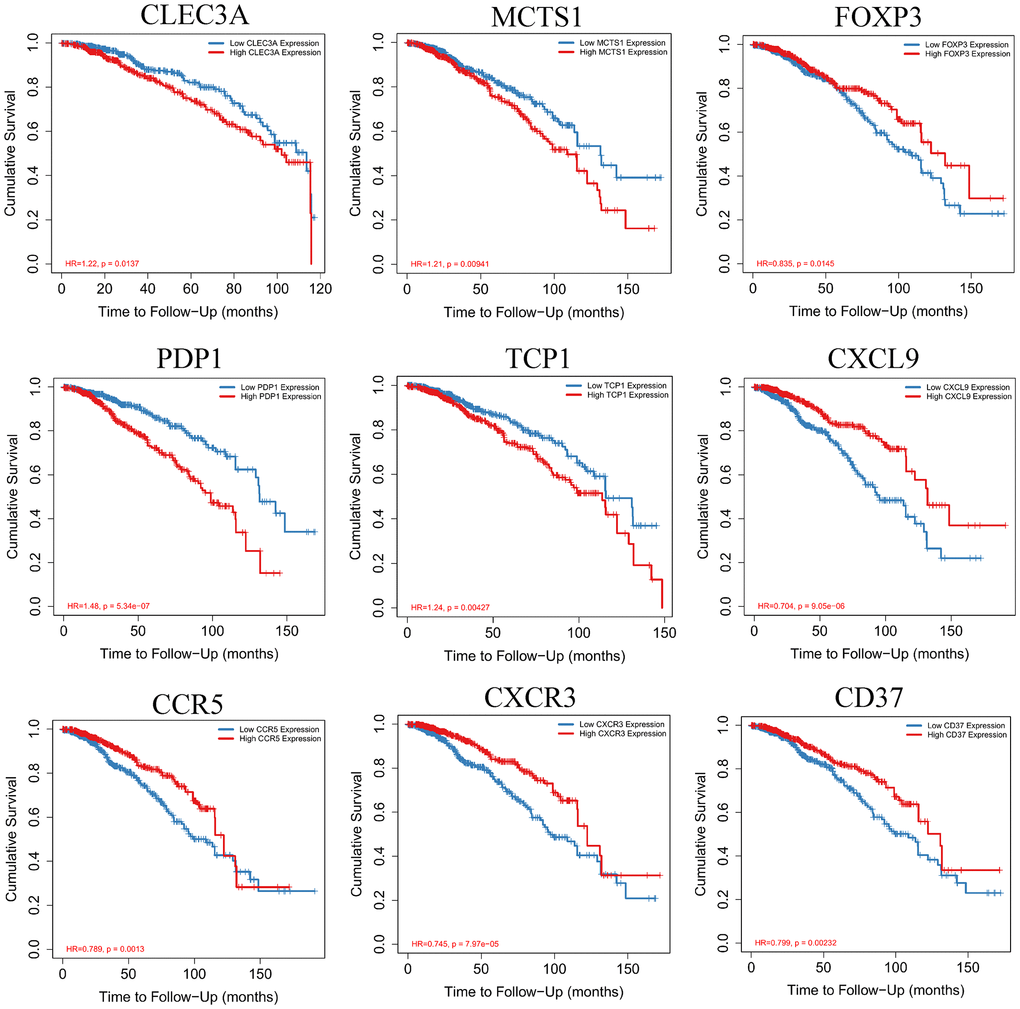
Figure 9. Kaplan-Meier survival curves with the log-rank test were performed for the hub genes.
The high expression of PDP1 in breast invasive carcinoma and correlation with clinical stage
To investigate the discrimination of PDP1 expression in breast invasive carcinoma tissues, the expression of PDP1 in BRCA and normal tissues by immunohistochemistry were performed. We detected the expression of PDP1 in 70 cases of breast cancer and 20 cases of adjacent tissues by Immunohistochemical staining. The result indicates that PDP1 expression is higher in BRCA tissues (Figure 10A and 10B) compared to non-cancerous tissues. We analyzed the expression of PDP1 in BRCA tissues and normal tissues by bioinformatics, and the result of bioinformatics analysis indicated that PDP1 level was higher in BRCA tissues than that in normal tissues (Figure 10C). Moreover, clinicopathological parameters from BRCA patients were extracted, and we found that highly expressed PDP1 was positively correlated with N stage of BRCA patients (Figure 10D). It was found that the high expression of PDP1 was negatively correlated with the invasion of CD8T cells in breast cancer (Figure 10E).
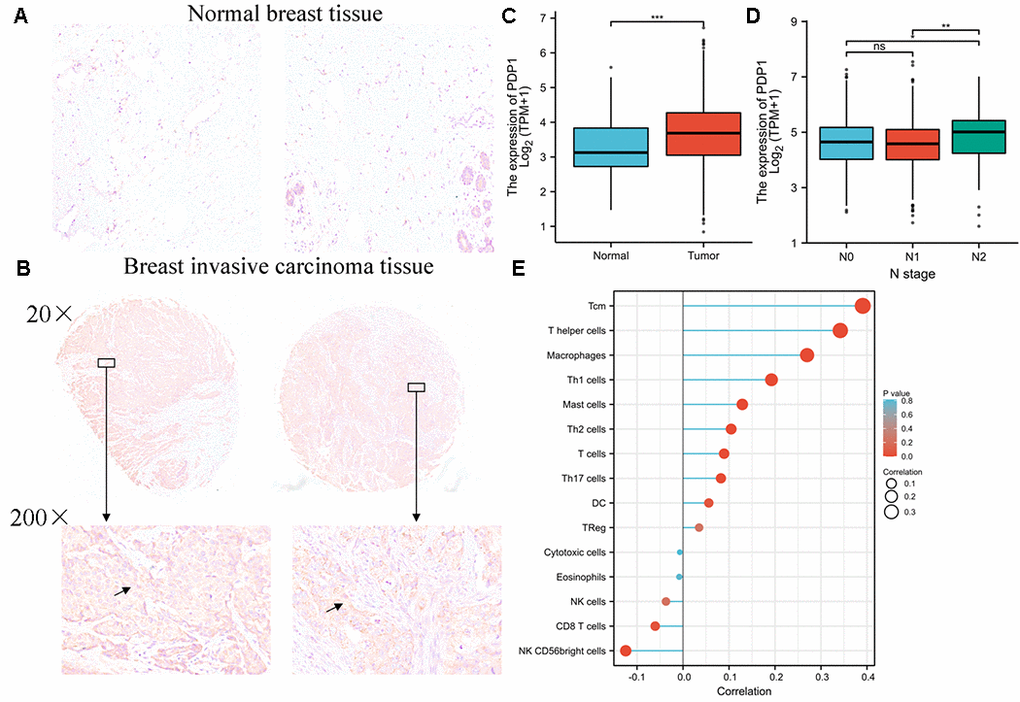
Figure 10. PDP1 was up-regulated in breast invasive carcinoma. (A) The level of PDP1 in normal tissues (n = 20) and (B) breast invasive carcinoma tissues (n = 70) was evaluated by immunohistochemical staining. The magnification is 100×. (C) The expression of PDP1 in BRCA tissues and normal tissues was analyzed by the cancer genome atlas (TCGA)-BRCA database. (D) The relationship between PDP1 expression and clinical N stage of breast cancer. (E) The relationship between PDP1 expression and breast cancer immune cell infiltration.
Discussion
Tumor immune microenvironment, including anti-tumor immune effecter cells and molecules and immunosuppressive cells and molecules, plays an important role in the occurrence, development and clinical outcome of tumor [19–21]. In the process of tumorigenesis and development, the immune system mainly goes through the following three processes: immune surveillance, immune balance and immune destruction [9, 22–24]. Immune cells not only play a natural anti-tumor role at the beginning of tumor invasion, but also become a tumor promoting phenotype in the process of tumor progression, assisting tumor immune escape and distant metastasis. At present, tumor microenvironment immune characteristics have been listed as one of the top ten characteristics of tumor; On the other hand, it may play a role in predicting the efficacy of chemoradiotherapy [25–27]. Therefore, it is of great clinical significance to analyze the types and distribution of immune cells in tumor microenvironment and establish an effective immune evaluation system. Stromal cells and immune cells in tumor tissue constitute the main components of the dynamic network of tumor microenvironment [28–30]. This paper focuses on the analysis of the state of tumor microenvironment of breast cancer, and explores new ideas for prognosis evaluation and treatment strategies of breast cancer. ESTIMATE (estimation of stromal and immune cells in malignant tumor tissues using expression data) algorithm is an important tool to predict the purity of tumor and the proportion of stromal/immune cells infiltrated in tumor tissues [31–33]. It is mainly based on the gene expression profile data of tumor tissues from TCGA database.
The infiltration of different types of immune cells in the microenvironment of breast cancer and its role in prognosis prediction are not yet clear. We used the CIBERSORT algorithm to analyze the gene expression of breast cancer tissue and analyzed the correlation between the different types of immune cell infiltration and the overall survival of breast cancer patients. We demonstrated that Macrophage M1 and T cell CD8 cells were positively related to 5-year overall survival in patients with BRCA. However, Macrophage M2 was negatively related to 5-year overall survival. There was no significant correlation between B cell plasma, T cell CD4+ memory activated, T cell follicular helper and the 5-year survival rate of breast cancer.
Tumor infiltrating lymphocytes (TILs) are a group of heterogeneous lymphocytes around tumors. A large number of studies believe that TILs are the markers of the host immune system’s immune response to tumor antigens. Gu-Trantien et al. [34] classified breast tumor infiltrating immune cells in detail, in which T lymphocytes accounted for about 75%, B lymphocytes accounted for less than 20%, monocytes accounted for about 10%, while NK cells and NK/T cells accounted for less than 5%. TILs can be divided into stromal tumor infiltrating lymphocytes (sTILs) and intraepithelial tumor infiltrating lymphocytes (iTILs). The former is located in the tumor stroma without direct contact with invasive cancer cells, while the latter is intraepithelial or intratumoral infiltrating cells in direct contact with cancer cells.
Furthermore, we analyzed the relationship between the breast cancer microenvironment and the prognosis of breast cancer patients. We found that the patients with high immune scores in the tumor microenvironment had a better prognosis than those with immune score. By analyzing and comparing the gene expression profiles of two groups with high and low score of breast cancer, we screened 1367 differentially expressed genes. Among them, 401 differentially expressed genes were significantly correlated with the prognosis of breast cancer patients. By constructing the protein interaction network and mining its core modules, we finally obtained 79 core differentially expressed genes associated with prognosis, and further verified 9 core prognostic differentially expressed genes (CLEC3A, MCTS1, FOXP3, PDP1, TCP1, CXCL9, CCR5, CXCR3 and CD37). The results showed that the low expression of four genes (CLEC3A, MCTS1, PDP1 and TCP1,) was related to favorable survival outcomes. High expression of FOXP3, CXCL9, CCR5, CXCR3, and CD37 was related to a high overall survival rate in BRCA.
In conclusion, this study used bioinformatics methods to screen and analyze differentially expressed genes that might be related to the immune microenvironment and prognosis of breast cancer, to identify potential regulatory mechanisms, and to predict potential therapeutic agents, so as to provide effective support for the prognosis evaluation and individualized treatment strategies of breast cancer.
Materials and Methods
TCGA-BRCA data downloading and processing
The raw data and clinical information were downloaded from the TCGA-BRCA project (https://cancergenome.nih.gov/). After removing the samples that had suffered from other malignant tumors and survived for more than 10 years, the final samples used in this study were tumor 968 cases and normal 106 cases.
Immune score and stromal score analysis
The immune infiltration status of each BRCA patient were determined by applying the the R package ESTIMATE algorithm. Briefly, the estimate algorithm is a tool to predict the proportion of stromal cells and immune cells in tumor tissue by using gene expression characteristics.
Identification of differential expressed genes with immune scores
BRCA patients were divided into high- and low immune score groups according to their median of immune score. Briefly, Deseq2 was applied to identify DEGs by comparing high/low IS or BRCA and normal samples. The Benjamini-Hochberg method was used to adjust the p-value. A gene with false discovery rate (FDR) adjusted p-value <0.05 and |log2FC|>1 is identified as DEG.
GO and KEGG enrichment analysis
To explore the function of DEGs regulated by methylation in the carcinogenesis and development of colon cancer, GO enrichment analysis was performed using DAVID database (https://david.ncifcrf.gov/) and three categories: cellular component (CC), molecular function (MF), and biological process (BP) were analyzed. In addition, KEGG pathways were analyzed using KEGG Orthology-Based Annotation System 3.0.
Analysis of the expression level of PDP1 in BRCA and normal tissues
The Oncomine database was used to identify the expression level of PDP1 in various types of tumor tissues. Screening conditions: P < 0.05, multiple of difference >1.5, the top 10% of genes are ranked, and the data type is mRNA. The expression level of PDP1 in BRCA and normal tissues in the TCGA database was compare and analyze.
PDP1 immunohistochemical staining
Tissue microarray containing 70 cases of breast cancer and 20 tissues was purchased from Shanghai OUTDO BIOTECH Company. After dewaxing and hydration, the tissue sections were sealed with goat serum at room temperature for 2 hours. Tissues section were followed by incubation with primary antibody against PDP1 (21176-1-AP, 1:100, Proteintech) for 12 h at 4°C. Thereafter, the sections were incubated with biotin labeled Goat anti rabbit IgG polymer and horseradish enzyme labeled Streptomyces ovalbumin working solution for 1 h. After that, the slides were then stained by 3, 3’-Diaminobenzidine (DAB) solution (Sigma-Aldrich) and subsequently counterstained with hematoxylin (Sigma-Aldrich). Finally, of immunohistochemical staining were obtained using Aperio Scanscope slide scanner (Leica, GT450).
Statistical analysis
Data were analyzed using R package. Data were represented as mean ± standard deviation (S.D.). All tests were two sided, and P < 0.05 was considered statistically significant.
Author Contributions
Xingfeng Chen, Yujing Wang and Fangzhou Song conceived of the study, and participated in experiment design and coordination and carried out draft of the manuscript. Xingfeng Chen, Geli Liu and Yue Li performed the retrieval of data and statistical analysis. All authors read and approved the final manuscript.
Conflicts of Interest
The authors declare no conflicts of interest related to this study.
Funding
This work was supported by Chongqing Technology Innovation and application demonstration project (No. cstc2018jscx-mszdX0031).
References
- 1. Liang Y, Zhang H, Song X, Yang Q. Metastatic heterogeneity of breast cancer: Molecular mechanism and potential therapeutic targets. Semin Cancer Biol. 2020; 60:14–27. https://doi.org/10.1016/j.semcancer.2019.08.012 [PubMed]
- 2. Yeo SK, Guan JL. Breast Cancer: Multiple Subtypes within a Tumor? Trends Cancer. 2017; 3:753–60. https://doi.org/10.1016/j.trecan.2017.09.001 [PubMed]
- 3. Venema CM, Bense RD, Steenbruggen TG, Nienhuis HH, Qiu SQ, van Kruchten M, Brown M, Tamimi RM, Hospers GAP, Schröder CP, Fehrmann RSN, de Vries EGE. Consideration of breast cancer subtype in targeting the androgen receptor. Pharmacol Ther. 2019; 200:135–47. https://doi.org/10.1016/j.pharmthera.2019.05.005 [PubMed]
- 4. Karamanou K, Franchi M, Vynios D, Brézillon S. Epithelial-to-mesenchymal transition and invadopodia markers in breast cancer: Lumican a key regulator. Semin Cancer Biol. 2020; 62:125–33. https://doi.org/10.1016/j.semcancer.2019.08.003 [PubMed]
- 5. Carvalho R, Paredes J, Ribeiro AS. Impact of breast cancer cells´ secretome on the brain metastatic niche remodeling. Semin Cancer Biol. 2020; 60:294–301. https://doi.org/10.1016/j.semcancer.2019.10.011 [PubMed]
- 6. Dieci MV, Radosevic-Robin N, Fineberg S, van den Eynden G, Ternes N, Penault-Llorca F, Pruneri G, D'Alfonso TM, Demaria S, Castaneda C, Sanchez J, Badve S, Michiels S, et al, and International Immuno-Oncology Biomarker Working Group on Breast Cancer. Update on tumor-infiltrating lymphocytes (TILs) in breast cancer, including recommendations to assess TILs in residual disease after neoadjuvant therapy and in carcinoma in situ: A report of the International Immuno-Oncology Biomarker Working Group on Breast Cancer. Semin Cancer Biol. 2018; 52:16–25. https://doi.org/10.1016/j.semcancer.2017.10.003 [PubMed]
- 7. Byrne A, Savas P, Sant S, Li R, Virassamy B, Luen SJ, Beavis PA, Mackay LK, Neeson PJ, Loi S. Tissue-resident memory T cells in breast cancer control and immunotherapy responses. Nat Rev Clin Oncol. 2020; 17:341–8. https://doi.org/10.1038/s41571-020-0333-y [PubMed]
- 8. Esteva FJ, Hubbard-Lucey VM, Tang J, Pusztai L. Immunotherapy and targeted therapy combinations in metastatic breast cancer. Lancet Oncol. 2019; 20:e175–86. https://doi.org/10.1016/S1470-2045(19)30026-9 [PubMed]
- 9. Krug K, Jaehnig EJ, Satpathy S, Blumenberg L, Karpova A, Anurag M, Miles G, Mertins P, Geffen Y, Tang LC, Heiman DI, Cao S, Maruvka YE, et al, and Clinical Proteomic Tumor Analysis Consortium. Proteogenomic Landscape of Breast Cancer Tumorigenesis and Targeted Therapy. Cell. 2020; 183:1436–56.e31. https://doi.org/10.1016/j.cell.2020.10.036 [PubMed]
- 10. Kim IS, Gao Y, Welte T, Wang H, Liu J, Janghorban M, Sheng K, Niu Y, Goldstein A, Zhao N, Bado I, Lo HC, Toneff MJ, et al. Immuno-subtyping of breast cancer reveals distinct myeloid cell profiles and immunotherapy resistance mechanisms. Nat Cell Biol. 2019; 21:1113–26. https://doi.org/10.1038/s41556-019-0373-7 [PubMed]
- 11. Ovais M, Mukherjee S, Pramanik A, Das D, Mukherjee A, Raza A, Chen C. Designing Stimuli-Responsive Upconversion Nanoparticles that Exploit the Tumor Microenvironment. Adv Mater. 2020; 32:e2000055. https://doi.org/10.1002/adma.202000055 [PubMed]
- 12. Zhou F, Feng B, Yu H, Wang D, Wang T, Ma Y, Wang S, Li Y. Tumor Microenvironment-Activatable Prodrug Vesicles for Nanoenabled Cancer Chemoimmunotherapy Combining Immunogenic Cell Death Induction and CD47 Blockade. Adv Mater. 2019; 31:e1805888. https://doi.org/10.1002/adma.201805888 [PubMed]
- 13. Zhang Z, Karthaus WR, Lee YS, Gao VR, Wu C, Russo JW, Liu M, Mota JM, Abida W, Linton E, Lee E, Barnes SD, Chen HA, et al. Tumor Microenvironment-Derived NRG1 Promotes Antiandrogen Resistance in Prostate Cancer. Cancer Cell. 2020; 38:279–96.e9. https://doi.org/10.1016/j.ccell.2020.06.005 [PubMed]
- 14. Aoki T, Chong LC, Takata K, Milne K, Hav M, Colombo A, Chavez EA, Nissen M, Wang X, Miyata-Takata T, Lam V, Viganò E, Woolcock BW, et al. Single-Cell Transcriptome Analysis Reveals Disease-Defining T-cell Subsets in the Tumor Microenvironment of Classic Hodgkin Lymphoma. Cancer Discov. 2020; 10:406–21. https://doi.org/10.1158/2159-8290.CD-19-0680 [PubMed]
- 15. Ma X, Bi E, Lu Y, Su P, Huang C, Liu L, Wang Q, Yang M, Kalady MF, Qian J, Zhang A, Gupte AA, Hamilton DJ, et al. Cholesterol Induces CD8+ T Cell Exhaustion in the Tumor Microenvironment. Cell Metab. 2019; 30:143–56.e5. https://doi.org/10.1016/j.cmet.2019.04.002 [PubMed]
- 16. Gao Z, Hou Y, Zeng J, Chen L, Liu C, Yang W, Gao M. Tumor Microenvironment- Triggered Aggregation of Antiphagocytosis 99mTc-Labeled Fe3 O4 Nanoprobes for Enhanced Tumor Imaging In Vivo. Adv Mater. 2017; 29:1701095. https://doi.org/10.1002/adma.201701095 [PubMed]
- 17. Pearce OMT, Delaine-Smith RM, Maniati E, Nichols S, Wang J, Böhm S, Rajeeve V, Ullah D, Chakravarty P, Jones RR, Montfort A, Dowe T, Gribben J, et al. Deconstruction of a Metastatic Tumor Microenvironment Reveals a Common Matrix Response in Human Cancers. Cancer Discov. 2018; 8:304–19. https://doi.org/10.1158/2159-8290.CD-17-0284 [PubMed]
- 18. Ruella M, Klichinsky M, Kenderian SS, Shestova O, Ziober A, Kraft DO, Feldman M, Wasik MA, June CH, Gill S. Overcoming the Immunosuppressive Tumor Microenvironment of Hodgkin Lymphoma Using Chimeric Antigen Receptor T Cells. Cancer Discov. 2017; 7:1154–67. https://doi.org/10.1158/2159-8290.CD-16-0850 [PubMed]
- 19. Zhou G, Sprengers D, Mancham S, Erkens R, Boor PPC, van Beek AA, Doukas M, Noordam L, Campos Carrascosa L, de Ruiter V, van Leeuwen RWF, Polak WG, de Jonge J, et al. Reduction of immunosuppressive tumor microenvironment in cholangiocarcinoma by ex vivo targeting immune checkpoint molecules. J Hepatol. 2019; 71:753–62. https://doi.org/10.1016/j.jhep.2019.05.026 [PubMed]
- 20. Erkes DA, Cai W, Sanchez IM, Purwin TJ, Rogers C, Field CO, Berger AC, Hartsough EJ, Rodeck U, Alnemri ES, Aplin AE. Mutant BRAF and MEK Inhibitors Regulate the Tumor Immune Microenvironment via Pyroptosis. Cancer Discov. 2020; 10:254–69. https://doi.org/10.1158/2159-8290.CD-19-0672 [PubMed]
- 21. Clara JA, Monge C, Yang Y, Takebe N. Targeting signalling pathways and the immune microenvironment of cancer stem cells - a clinical update. Nat Rev Clin Oncol. 2020; 17:204–32. https://doi.org/10.1038/s41571-019-0293-2 [PubMed]
- 22. Vuong L, Kotecha RR, Voss MH, Hakimi AA. Tumor Microenvironment Dynamics in Clear-Cell Renal Cell Carcinoma. Cancer Discov. 2019; 9:1349–57. https://doi.org/10.1158/2159-8290.CD-19-0499 [PubMed]
- 23. Keren L, Bosse M, Marquez D, Angoshtari R, Jain S, Varma S, Yang SR, Kurian A, Van Valen D, West R, Bendall SC, Angelo M. A Structured Tumor-Immune Microenvironment in Triple Negative Breast Cancer Revealed by Multiplexed Ion Beam Imaging. Cell. 2018; 174:1373–87.e19. https://doi.org/10.1016/j.cell.2018.08.039 [PubMed]
- 24. Gil Del Alcazar CR, Huh SJ, Ekram MB, Trinh A, Liu LL, Beca F, Zi X, Kwak M, Bergholtz H, Su Y, Ding L, Russnes HG, Richardson AL, et al. Immune Escape in Breast Cancer During In Situ to Invasive Carcinoma Transition. Cancer Discov. 2017; 7:1098–115. https://doi.org/10.1158/2159-8290.CD-17-0222 [PubMed]
- 25. Karn T, Jiang T, Hatzis C, Sänger N, El-Balat A, Rody A, Holtrich U, Becker S, Bianchini G, Pusztai L. Association Between Genomic Metrics and Immune Infiltration in Triple-Negative Breast Cancer. JAMA Oncol. 2017; 3:1707–11. https://doi.org/10.1001/jamaoncol.2017.2140 [PubMed]
- 26. Savas P, Salgado R, Denkert C, Sotiriou C, Darcy PK, Smyth MJ, Loi S. Clinical relevance of host immunity in breast cancer: from TILs to the clinic. Nat Rev Clin Oncol. 2016; 13:228–41. https://doi.org/10.1038/nrclinonc.2015.215 [PubMed]
- 27. Koelwyn GJ, Newman AAC, Afonso MS, van Solingen C, Corr EM, Brown EJ, Albers KB, Yamaguchi N, Narke D, Schlegel M, Sharma M, Shanley LC, Barrett TJ, et al. Myocardial infarction accelerates breast cancer via innate immune reprogramming. Nat Med. 2020; 26:1452–8. https://doi.org/10.1038/s41591-020-0964-7 [PubMed]
- 28. Lim B, Woodward WA, Wang X, Reuben JM, Ueno NT. Inflammatory breast cancer biology: the tumour microenvironment is key. Nat Rev Cancer. 2018; 18:485–99. https://doi.org/10.1038/s41568-018-0010-y [PubMed]
- 29. Michea P, Noël F, Zakine E, Czerwinska U, Sirven P, Abouzid O, Goudot C, Scholer-Dahirel A, Vincent-Salomon A, Reyal F, Amigorena S, Guillot-Delost M, Segura E, Soumelis V. Adjustment of dendritic cells to the breast-cancer microenvironment is subset specific. Nat Immunol. 2018; 19:885–97. https://doi.org/10.1038/s41590-018-0145-8 [PubMed]
- 30. Su S, Liao J, Liu J, Huang D, He C, Chen F, Yang L, Wu W, Chen J, Lin L, Zeng Y, Ouyang N, Cui X, et al. Blocking the recruitment of naive CD4+ T cells reverses immunosuppression in breast cancer. Cell Res. 2017; 27:461–82. https://doi.org/10.1038/cr.2017.34 [PubMed]
- 31. Yoshihara K, Shahmoradgoli M, Martínez E, Vegesna R, Kim H, Torres-Garcia W, Treviño V, Shen H, Laird PW, Levine DA, Carter SL, Getz G, Stemke-Hale K, et al. Inferring tumour purity and stromal and immune cell admixture from expression data. Nat Commun. 2013; 4:2612. https://doi.org/10.1038/ncomms3612 [PubMed]
- 32. Liu Q, Fang Y, Wang J. ESTIMATE algorithm is not appropriate for inferring tumor purity and stromal and immune cell admixture in hematopoietic or stromal tumors. Cancer Immunol Immunother. 2020; 69:1153–4. https://doi.org/10.1007/s00262-020-02526-7 [PubMed]
- 33. Sorscher SM. Next-Generation Sequencing of Tumors to Better Estimate the Clinical Significance of Non- BRCA Germline Deleterious Mutations. J Clin Oncol. 2016; 34:4183. https://doi.org/10.1200/JCO.2016.67.7724 [PubMed]
- 34. Gu-Trantien C, Loi S, Garaud S, Equeter C, Libin M, de Wind A, Ravoet M, Le Buanec H, Sibille C, Manfouo-Foutsop G, Veys I, Haibe-Kains B, Singhal SK, et al. CD4+ follicular helper T cell infiltration predicts breast cancer survival. J Clin Invest. 2013; 123:2873–92. https://doi.org/10.1172/JCI67428 [PubMed]