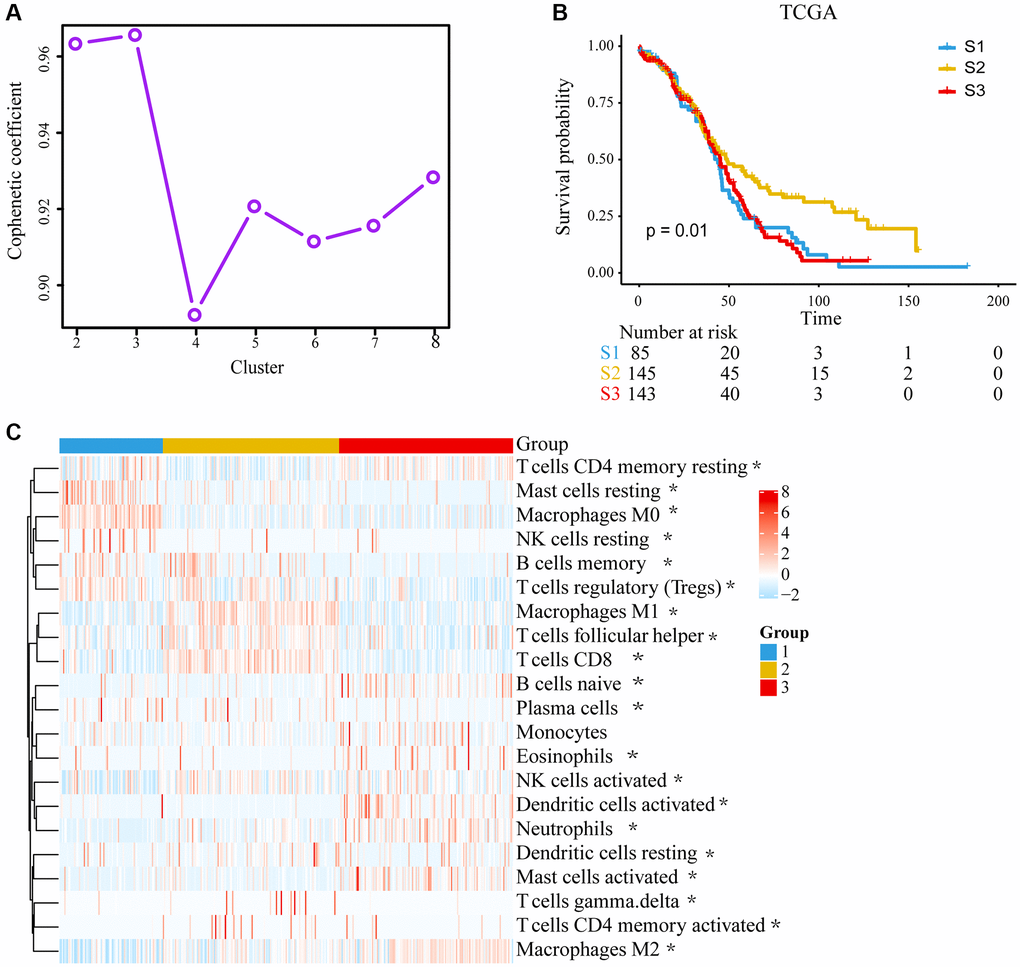
Figure 1.Unsupervised clustering of tumor microenvironment (TME) cells and subtype characteristics for 373 ovarian cancer patients in the TCGA cohort. (A) Cophenetic correlation coefficient of different clusters. (B) Kaplan–Meier (K–M) curves for overall survival (OS) of different 3 subtypes (log-rank test, P = 0.010). (C) Expression pattern of 21 TME cell types in 3 TME subtypes. The differences were confirmed by Kruskal–Wallis tests in the three TME subgroups with TME cell infiltration, and they were statistically significant except Monocytes. The asterisks represented the statistical P value. (*P < 0.05).