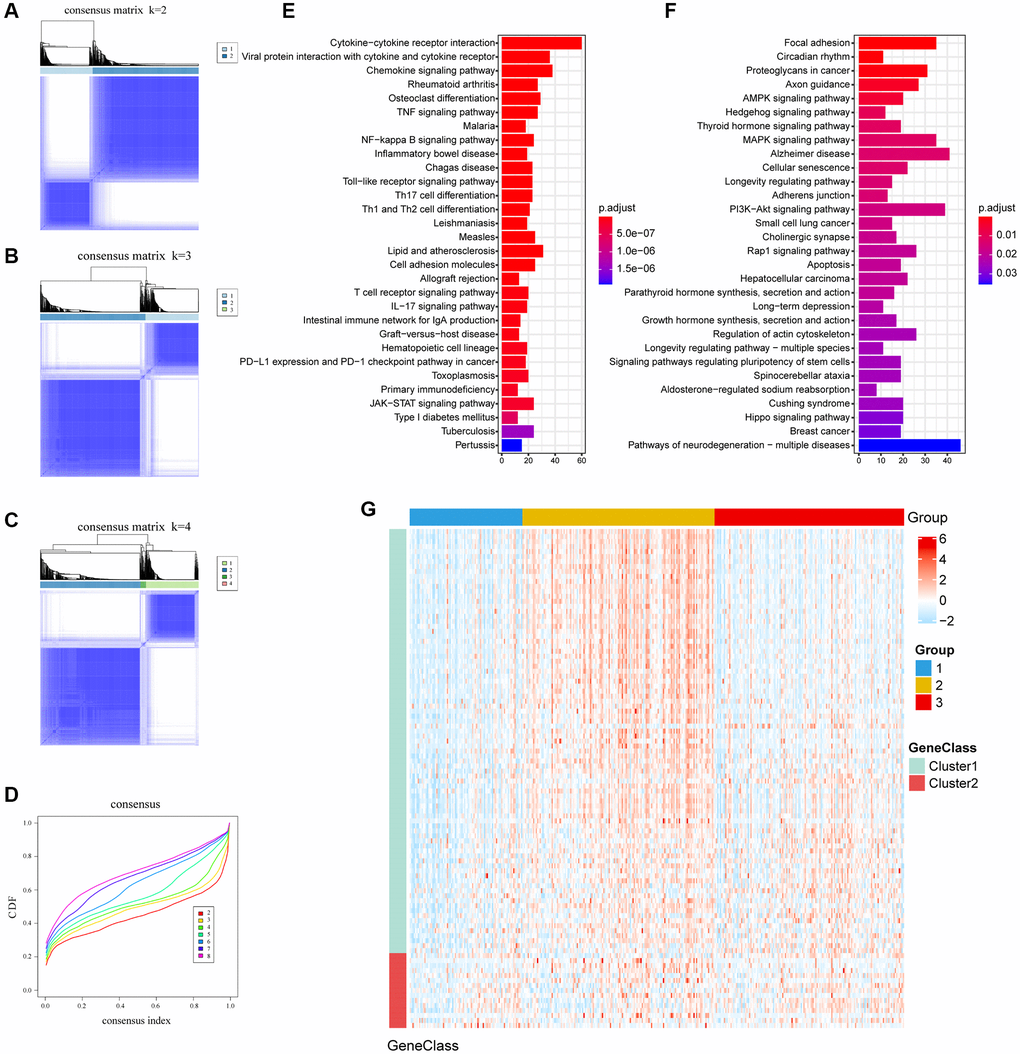
Figure 2.The clusters of DEGs with consensus clustering algorithm and KEGG enrichment. (A–C) Consensus matrixes of TCGA cohorts for each k (k = 2–4), displaying the clustering stability using 1000 iterations of hierarchical clustering. (D) Cumulative distribution function (CDF) curve; Different colors represent different clusters, x-axis denotes consensus index and y-axis denotes CDF values. (E, F) Enrichment pathways of the top 30 KEGG in gene cluster A and gene cluster B. (G) Expression profile heatmap of top 100 DEGs obtained by LIMMA and Random Forest.