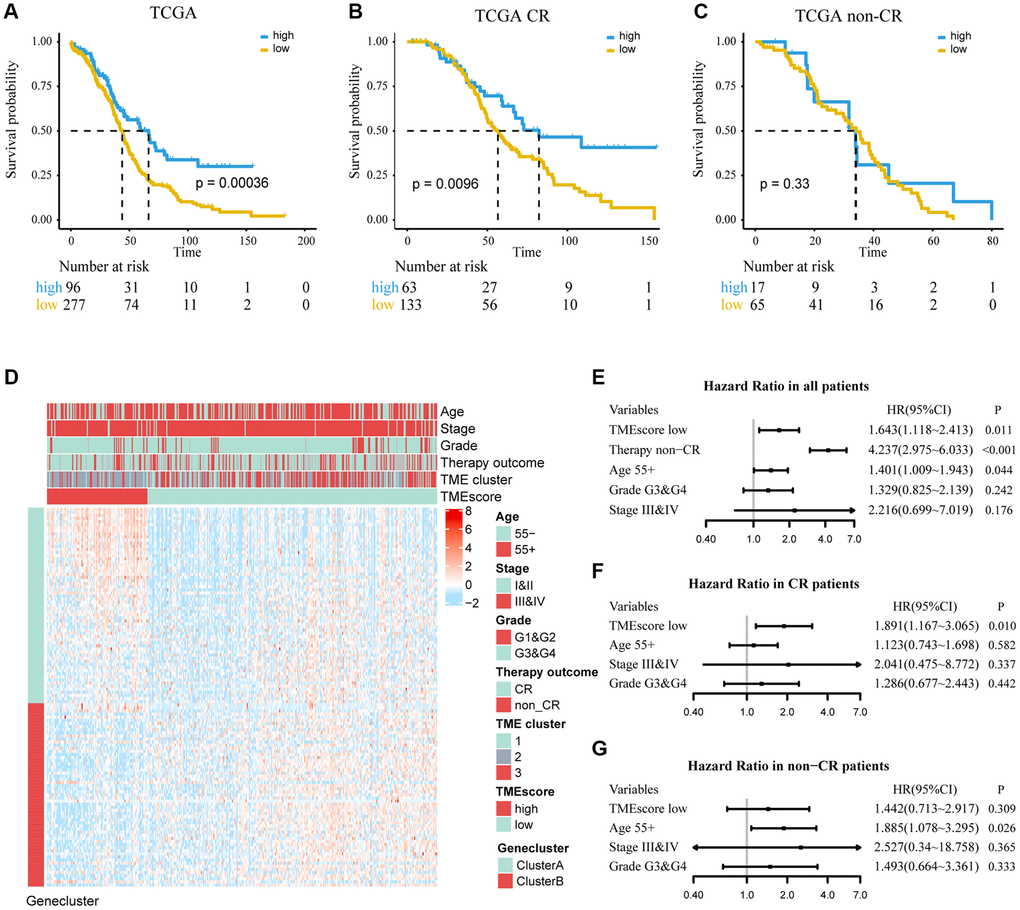
Figure 3.Determine the prognostic group of 373 ovarian cancer patients based on TMEscore in TCGA and evaluate the predictive ability. (A) K–M curve for OS of different TMEscore groups (log-rank test, P < 0.001). (B, C) According to chemotherapy outcome-stratified analysis (278 ovarian cancer patients), K–M curves in patients with complete response (CR) or non-complete response (non-CR) in different TMEscore group (log-rank test, P = 0.001; log-rank test, P = 0.33). (D) Expression profile of DEGs with survival significance. TMEscore, age, stage, grade, therapy outcome and TME cluster are shown as patient annotations. GeneClass is shown as gene annotations. Top legend, gray indicates missing value. (E–G) Forest plots illustrate the results of multivariate Cox proportional hazards model of clinical feature in all patients, CR patients and non-CR patients respectively.