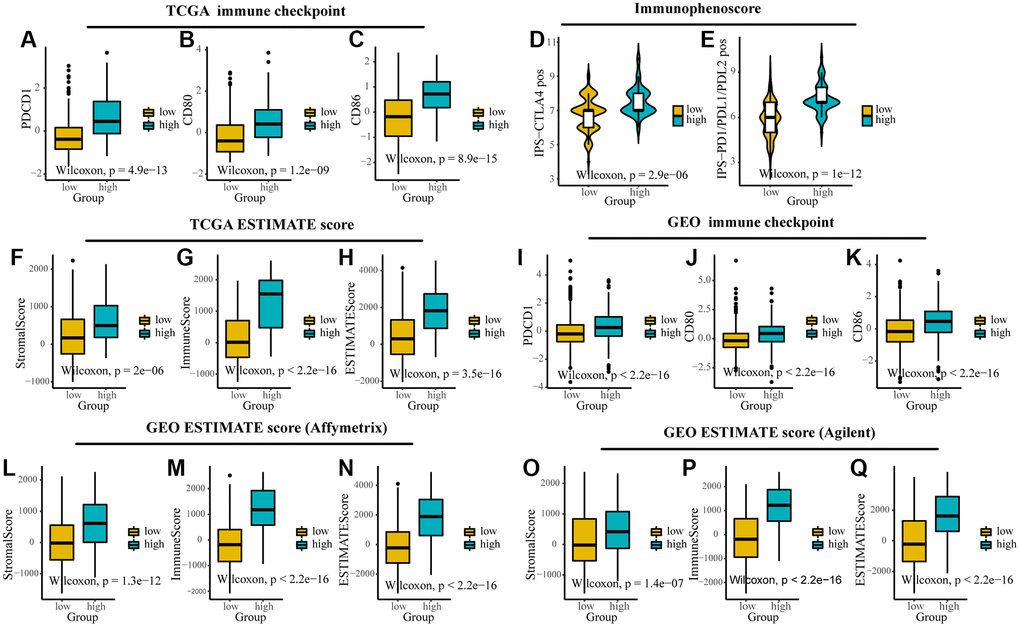
Figure 5.The expression of immune checkpoints and immune-related scores between different TMEscore groups in TCGA and GEO. (A–C) Expression of immune checkpoints (PDCD1, CD80 and CD86) between different groups in TCGA. (D, E) The relative probabilities to respond to anti-CTLA-4 and anti-PD-1/PD-L1 treatment in the low and high TMEscore group. (F–I) Expression of stromal score, immune score and ESTIMATE score between different groups in TCGA. (J–L) Expression of immune checkpoints (PDCD1, CD80 and CD86) between different groups in GEO. (M–Q) Expression of stromal score, immune score and ESTIMATE score between different groups in different platforms in GEO. The lines in the boxes represented median value.