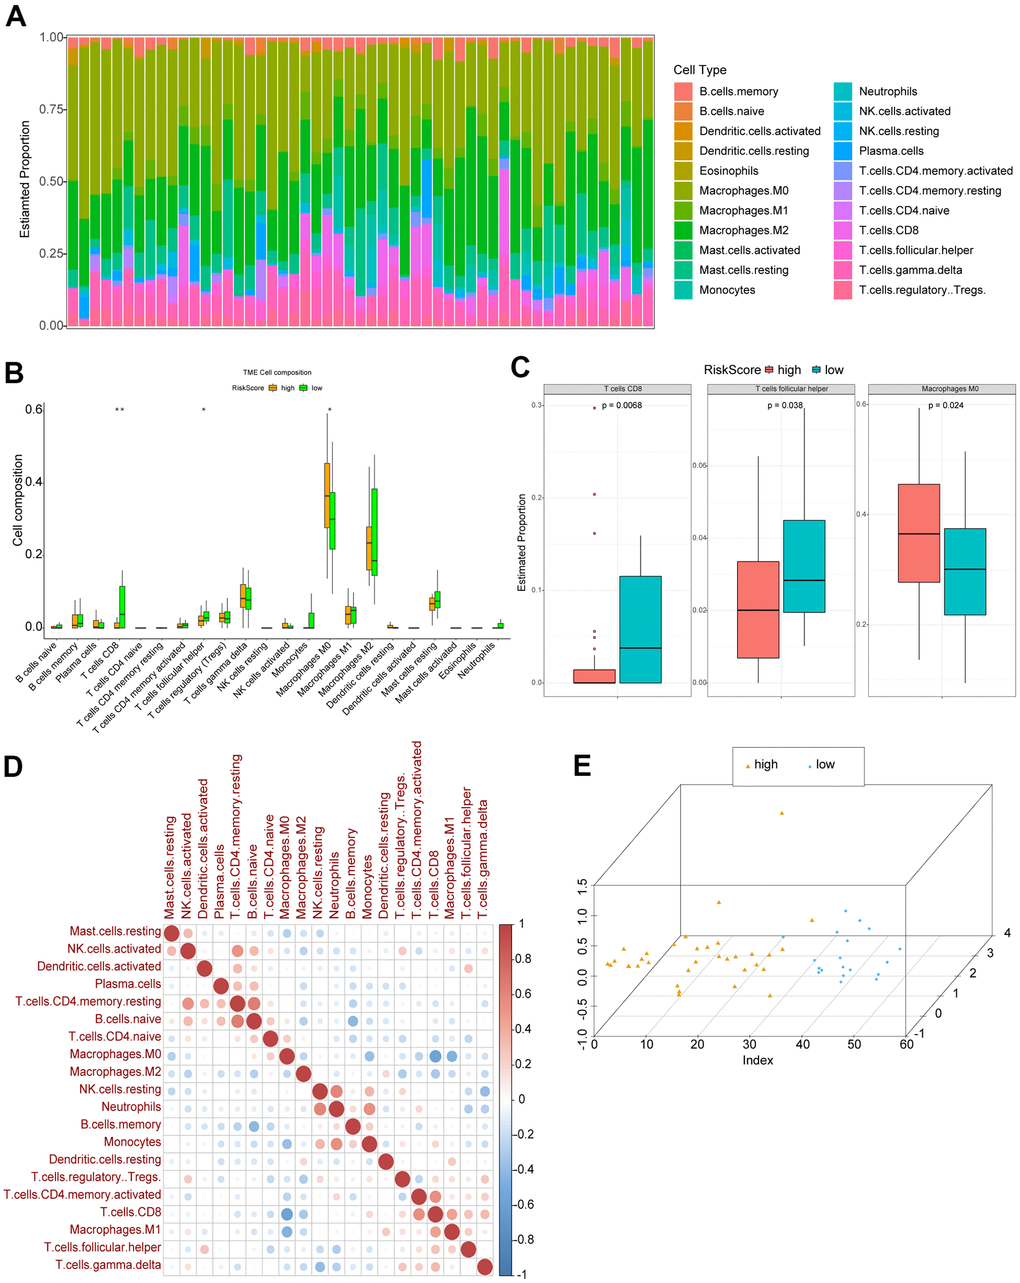
Figure 5.Immune cell infiltration in high and low risk OS patients. (A) The relative proportions of immune infiltrating cells in OS patients. (B) Differentially infiltrated immune cells between high and low risk OS patients. P was calculated with Wilcoxon method. (C) Three types of immune cells significantly differentially infiltrated. (D) Correlation matrix of various immune cells’ infiltrating proportions. Red: positive correlation; blue: negative correlation. (E) The results of PCA.