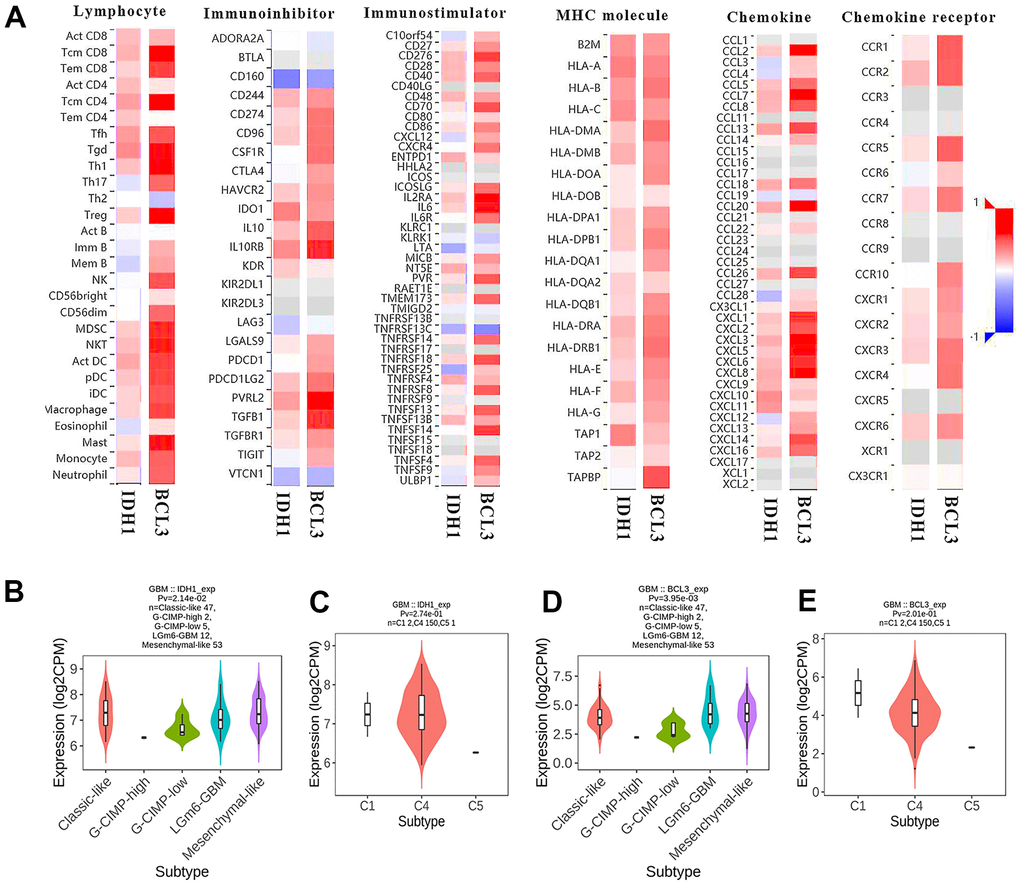
Figure 8.The immunoscore of BCL3 and IDH1 level. (A) The heat map shows the correlation between IDH1 or BCL3 levels and various immune indexes. The red box represents positive correlation and the blue one represents negative correlation. (B–E) The violin plots represent the expression of IDH1 and BCL3 in various subtypes.