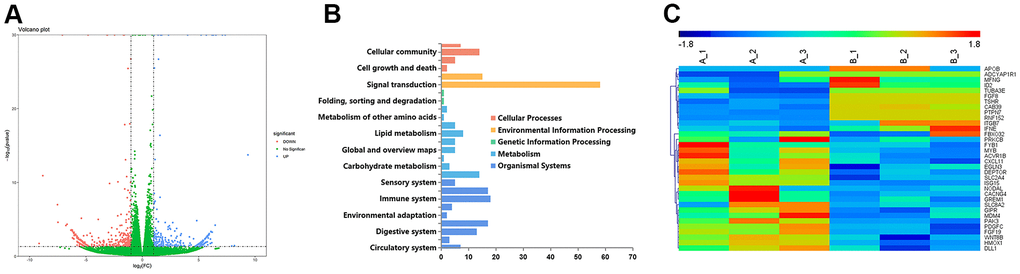
Figure 2.Volcano plot comparing gene expression between the interference group (infected with ILF3-specific siRNA) and the transfected negative control group in gastric cancer cell SGC-7901, respectively named si-ILF3 group and si-nc group. (A) The abscissa represents the logarithmic value of the fold change(log2FC) of the difference in the expression of a certain gene in the si-ILF3 group and si-nc group. The greater the absolute value of the abscissa, the greater the difference of expression between the two groups. The y-coordinate represents the negative log of p-value, namely the -log10 (p-value). The higher the value of ordinate was, the more the differential expression of genes was reliable. (B) The potential important roles that ILF3 played in the gastric cancer cells. (C) Genes that were potentially regulated by ILF3 expression in whole-genome RNA sequencing.