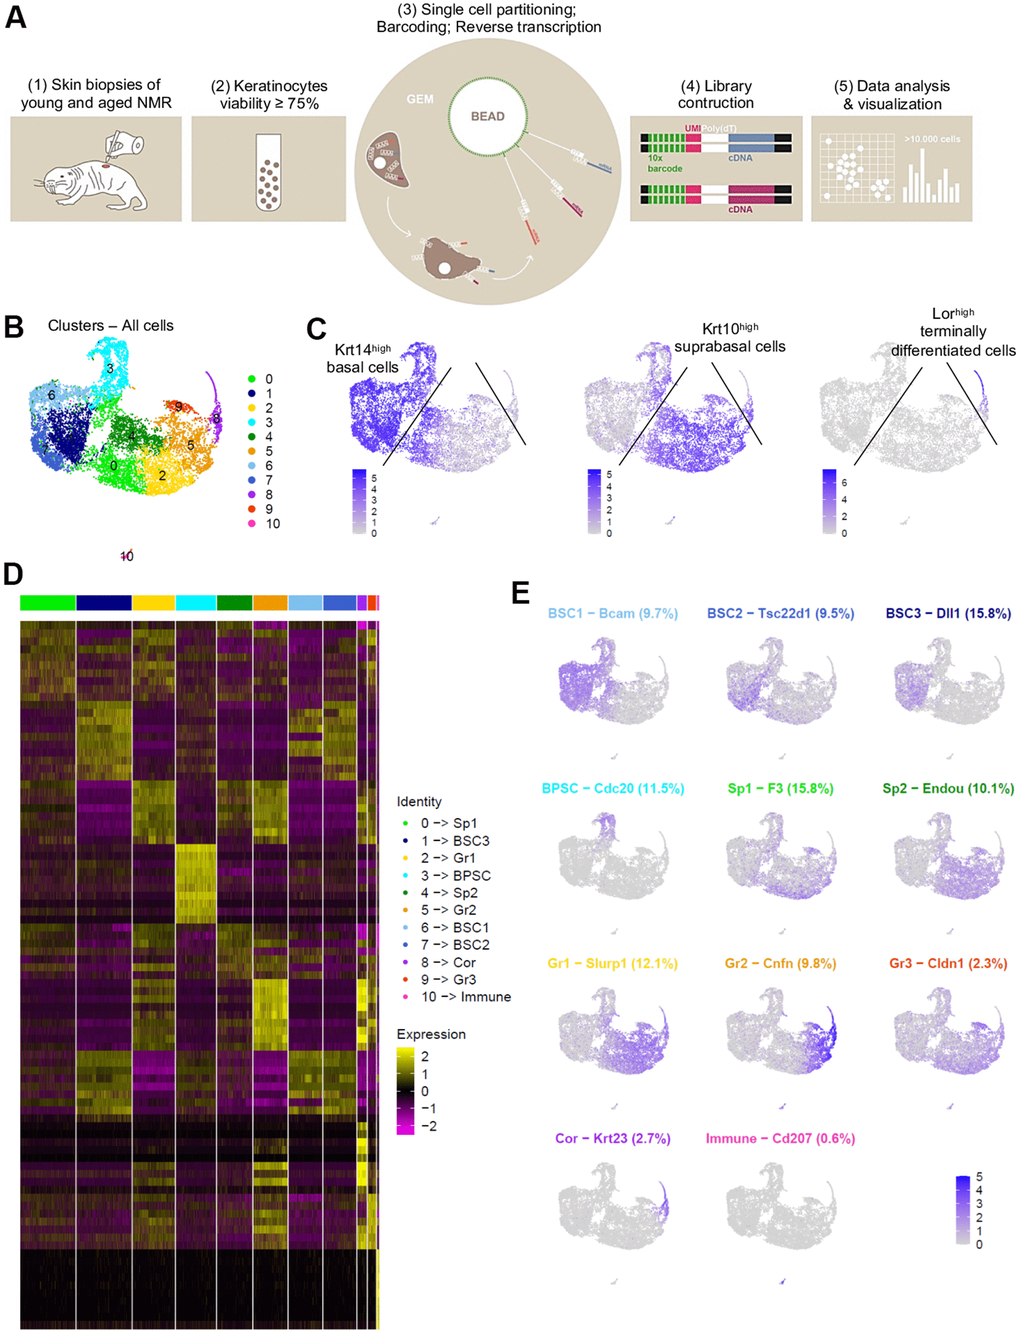
Figure 2.Cell populations characterization of NMR epidermis using single-cell RNA-sequencing (scRNA-seq). (A) Overview of the experimental workflow. (B) Global epidermal cell transcriptomes (n=10,232 cells) visualized with Uniform Manifold Approximation and Projection (UMAP), colored according to unsupervised clustering to better compare different cell subtypes. 11 different cell clusters were found, numbered from 0 to 10. (C) Expression of the 3 main marker genes during epidermal differentiation (Krt14, Krt10, Lor) projected onto UMAP. Cells were sub-divided into 3 main groups according to the differential epidermal cellular states: basal (Krt14high), suprabasal/intermediate (Krt10high) and corneous (Lor+) layers. Cells with the highest expression level are colored dark blue. (D) Heatmap of differentially expressed genes. For each cluster, the most differentially expressed genes and their relative expression levels in all sequenced epidermal cells are shown. Cells are represented in columns, and genes in rows. 3 selected genes for each cluster were color-coded and annotated on the right. The 10 clusters were identified as: basal and stem cells BSC1-2-3 for clusters 6-7-1; basal proliferating and stem cells BPSC for cluster 3; spinous layer cells Sp1 and Sp2 for clusters 0-4; granular layer cells Gr1-2-3 for clusters 2-5-9 respectively; corneous layer cells Cor for cluster 8; immune for immune cells cluster 10. (E) Expression levels for each cell are color-coded and overlaid onto UMAP plot for one selected cluster-specific gene. Cells with the highest expression level are colored dark blue. % of cells in each cluster is annotated.