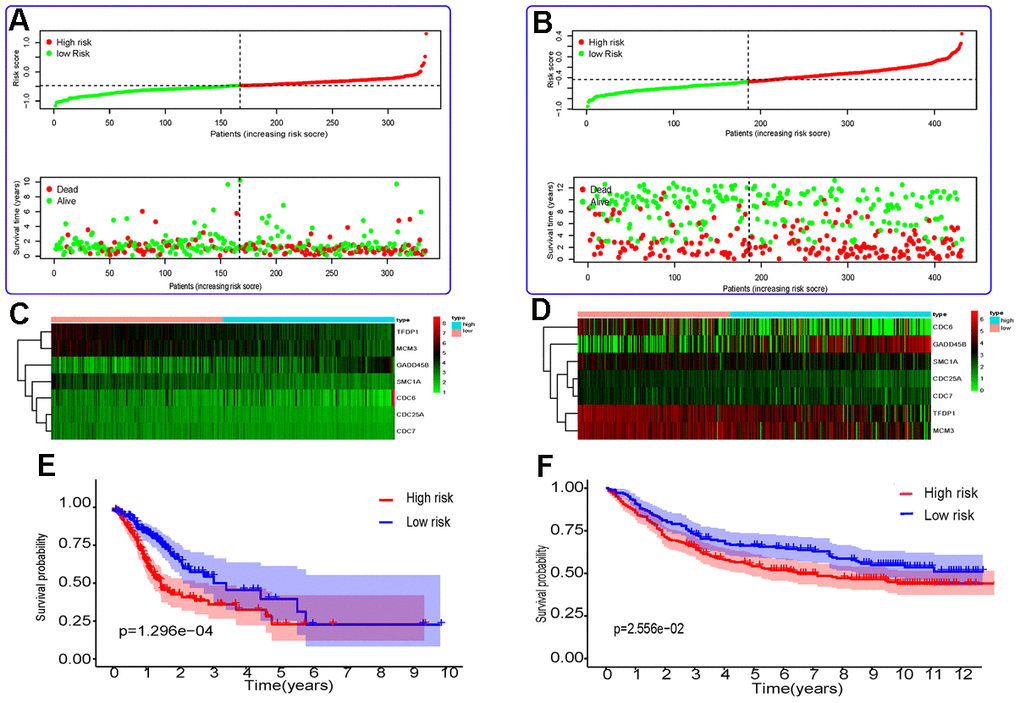
Figure 1.Risk score analysis and Kaplan–Meier survival analysis for seven differentially expressed genes in GC. (A, B) The distribution of risk score and patient’s survival time, as well as status for TCGA-STAD (A) and GSE84437 (B). (C, D) Heatmap of the autophagy-associated gene expression profiles in prognostic signature for TCGA-STAD (C) and GSE84437 (D). (E, F) Kaplan-Meier curves of seven differentially expressed genes from TCGA-STAD (E) and GSE84437 (F).