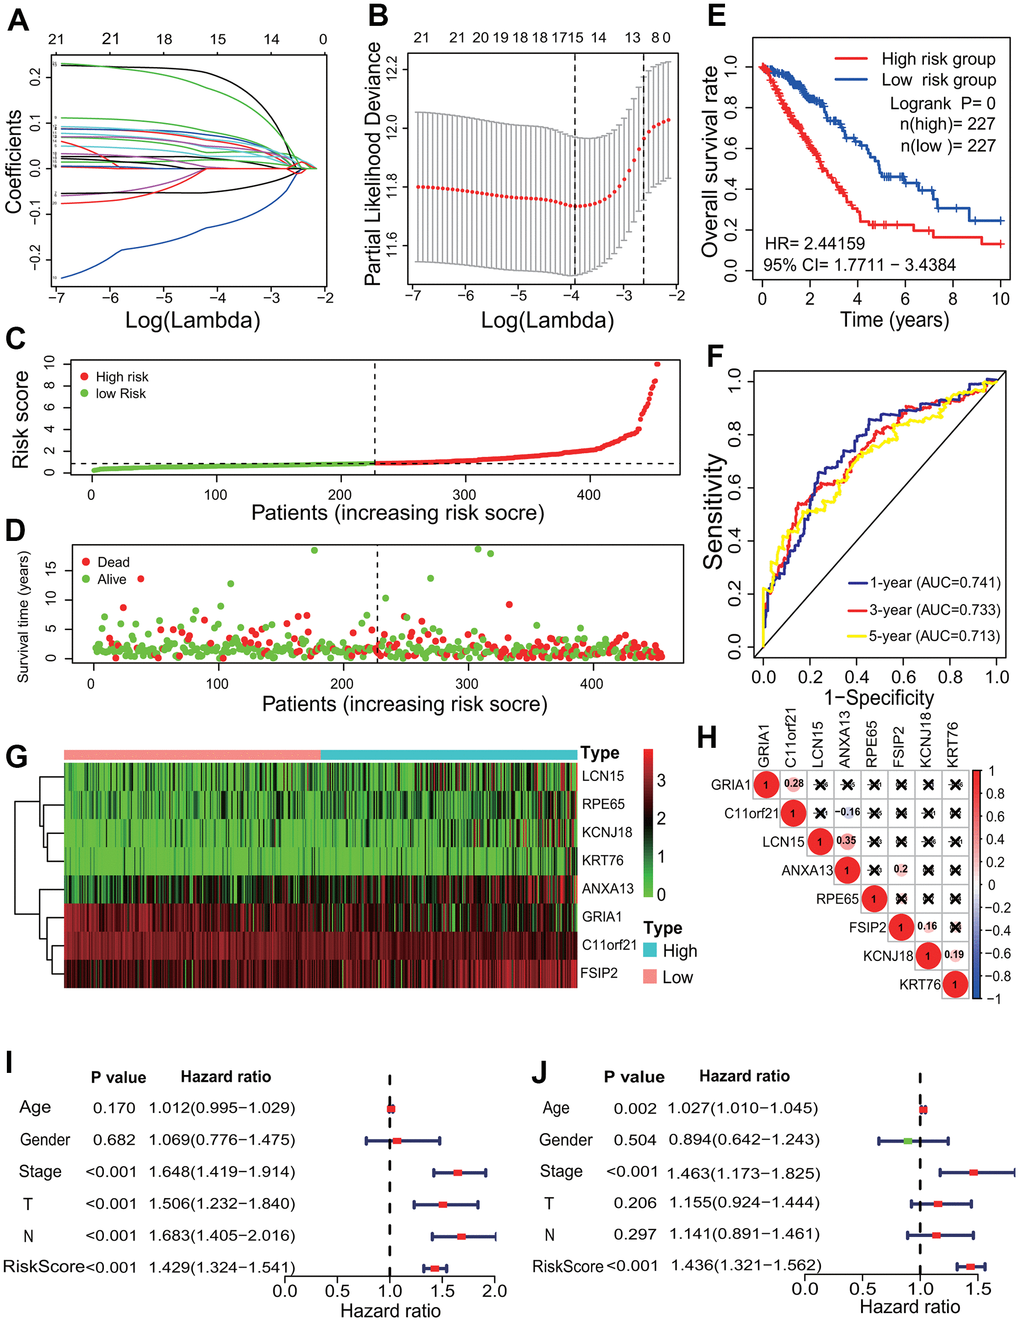
Figure 5.Prognostic signature analysis of key differentially expressed genes. (A, B) LASSO Cox analysis. Fifteen DEGs most correlated with the overall survival were identified, and 10-round cross validation was performed to prevent overfitting. (C) Risk score distribution. The LUAD patients were divided into the high- and low-risk groups according to the median risk score. (D) Survival overview. The distribution of survival times of the LUAD patients in the high- and low-risk groups. (E) Survival curve. The patients in the low-risk group exhibited a better overall survival rate than those in the high-risk group (p=0, HR=2.44159, 95% CI=1.7711-3.4384). (F) ROC curve. The ROC curve showed that the AUCs of 1-, 3- and 5-year of the 8-mRNA prognostic signature were separately 0.741, 0.733 and 0.713. (G) The heatmap of gene expression. Six DEGs (KCNJ18, RPE65, LCN15, ANXA13, FSIP2 and KRT76) and two DEGs (GRIA1, C11orf21) were highly and lowly expressed in the high-risk group, respectively. (H) Expression correlation among genes. The expressions among 8 DEGs had no significant correlations. (I, J) Independent prognostic analysis. The 8-mRNA prognostic signature was significantly correlated with the OS of LUAD patients by a univariate Cox regression analysis and a multivariate Cox regression analysis. LASSO, least absolute shrinkage and selection operator; LUAD, lung adenocarcinoma; ROC, receiver operating characteristic; AUC, area under curve; OS, overall survival, DEG, differentially expressed gene.