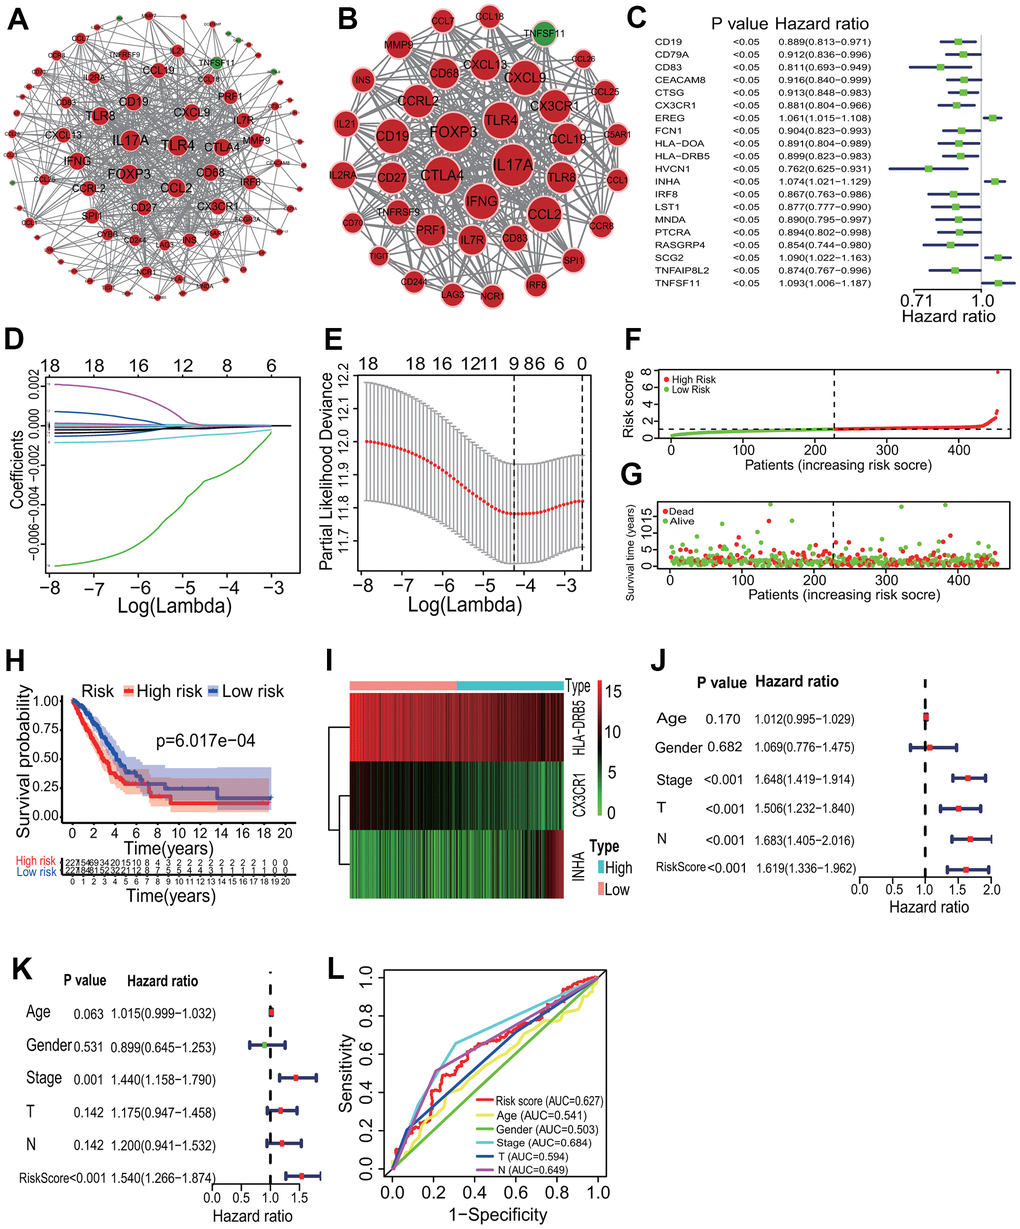
Figure 6.Key immune gene identification and prognostic immune signature construction. (A) PPI network of immune DEGs. An immune PPI network with 79 nodes and 538 edges was established. (B) Highly correlated PPI network. An immune PPI subnetwork with 38 nodes and 372 edges was constructed in the whole immune PPI network. (C) Univariate regression analysis. Twenty immune genes had significantly prognostic values. (D, E) LASSO Cox analysis. Nine immune genes most correlated with the overall survival were identified, and 10-round cross validation was performed to prevent overfitting. (F) Risk score distribution. LUAD patients were divided into the high- and low-risk groups according to the median risk score. (G) Survival overview. The distribution of survival times of LUAD patients in the high- and low-risk groups. (H) Survival curve. A better overall survival of patients in the low-risk group was exhibited than that in the high-risk group. (I) Heatmap of gene expression. HLA-DRB5 and CX3CR1 were highly expressed and INHA was lowly expressed in the high-risk group. (J, K) Independent prognostic analysis. The 3-mRNA risk signature was significantly correlated with the OS of LUAD patients by a univariate and a multivariate Cox regression analysis. (L) ROC curve. The AUC of 3-year survival was 0.627. PPI, protein and protein interaction; LASSO, least absolute shrinkage and selection operator; LUAD, lung adenocarcinoma; ROC, receiver operating characteristic; AUC, area under the curve; OS, overall survival.