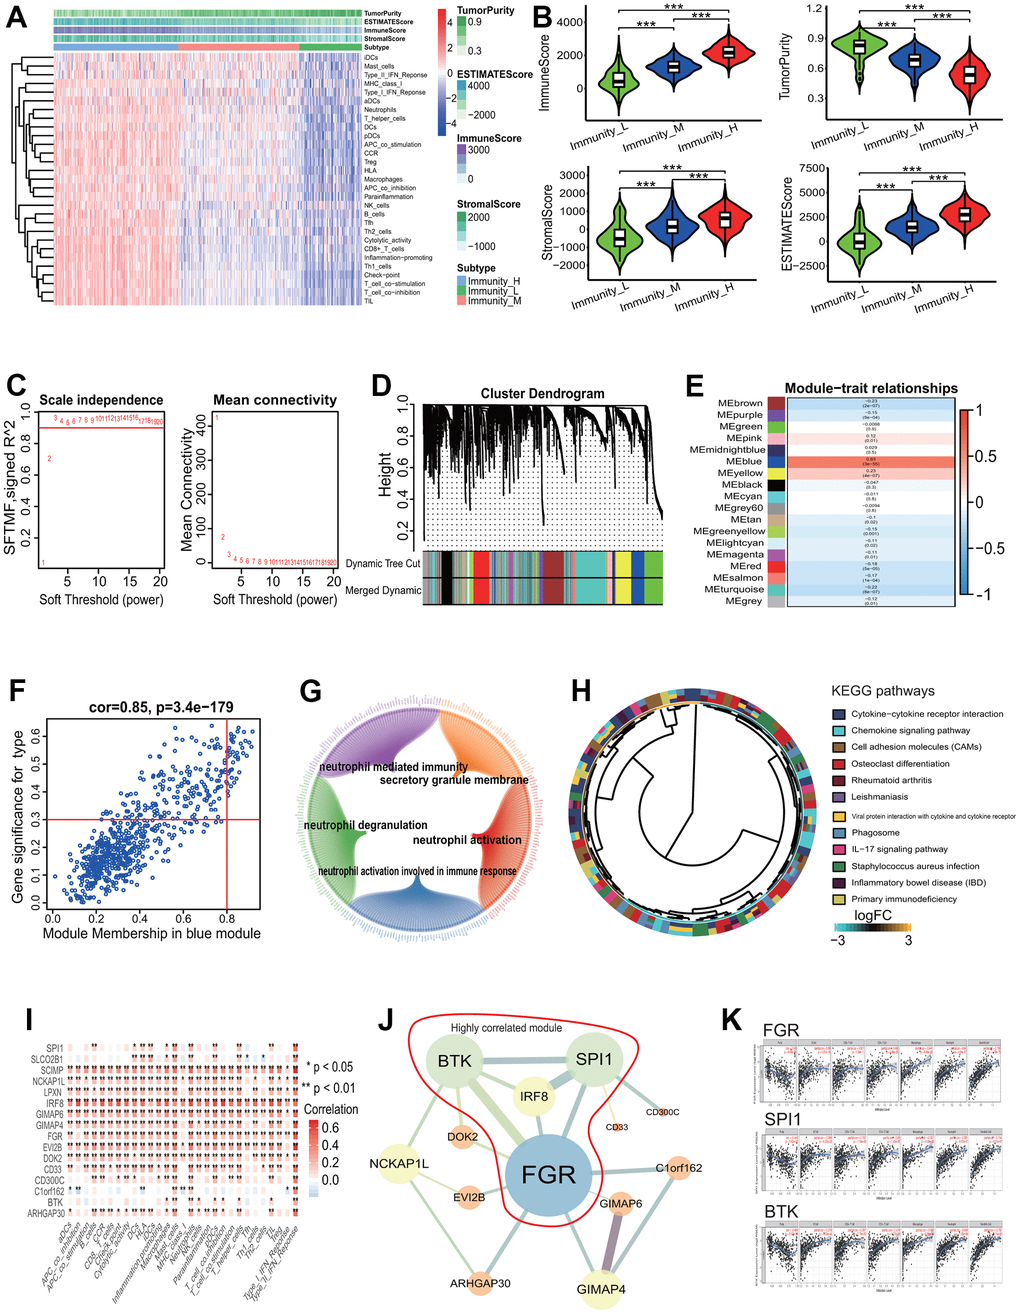
Figure 9.Gene coexpression analysis based on LUAD with differing immune phenotype. (A) Unsupervised clustering of LUAD patients from the TCGA cohort using ssGSEA scores from immune cell types. The group with higher immune infiltration had a higher immune score. (B) ssGSEA scores in differing TME immune phenotypes. The group with higher immune infiltration had higher immune score, stromal score and ESTIMATE score and lower tumor purity. (C) Analysis of network topology for various soft-threshold powers. The power parameter β=3 was selected to strengthen the correlation adjacency matrix on the basis of a scale-free topology criterion R2>0.9. (D) Identification of gene coexpression modules associated with immune phenotype. Eighteen gene coexpression modules were identified according to the TOM-based dissimilarity measure. (E) Associations of identified modules and immune phenotype. The blue module was the most significant association with the immune phenotype. (F) Correlations of module memberships and gene significance in blue module. The Pearson correlation coefficient was 0.85 and the p value was 3.4e-179. (G) Relationship network of the most significant module genes and top 5 GO enrichment terms. (H) The KEGG pathways enriched by genes in the most significant module. (I) Correlations of immune-related terms and 16 genes associated with survival. There were very strong positive correlations between them. (J) Interaction relationship network of 13 genes among 16 genes associated with survival. Bigger nodes represented more links. Thicker edges represented more combined score. The genes within the red line were highly correlated module genes in the whole network. (K) Correlations of 3 key genes and immune infiltration of some types of cells. The expressions of 3 genes were significant positively correlated with the immune infiltration levels of some types of cells. LUAD, lung adenocarcinoma; TCGA, the cancer genome atlas; ssGSEA, single-sample gene set enrichment analysis; KEGG, Kyoto Encyclopedia of Genes and Genomes; GO, gene ontology, TOM, topological overlap measure.