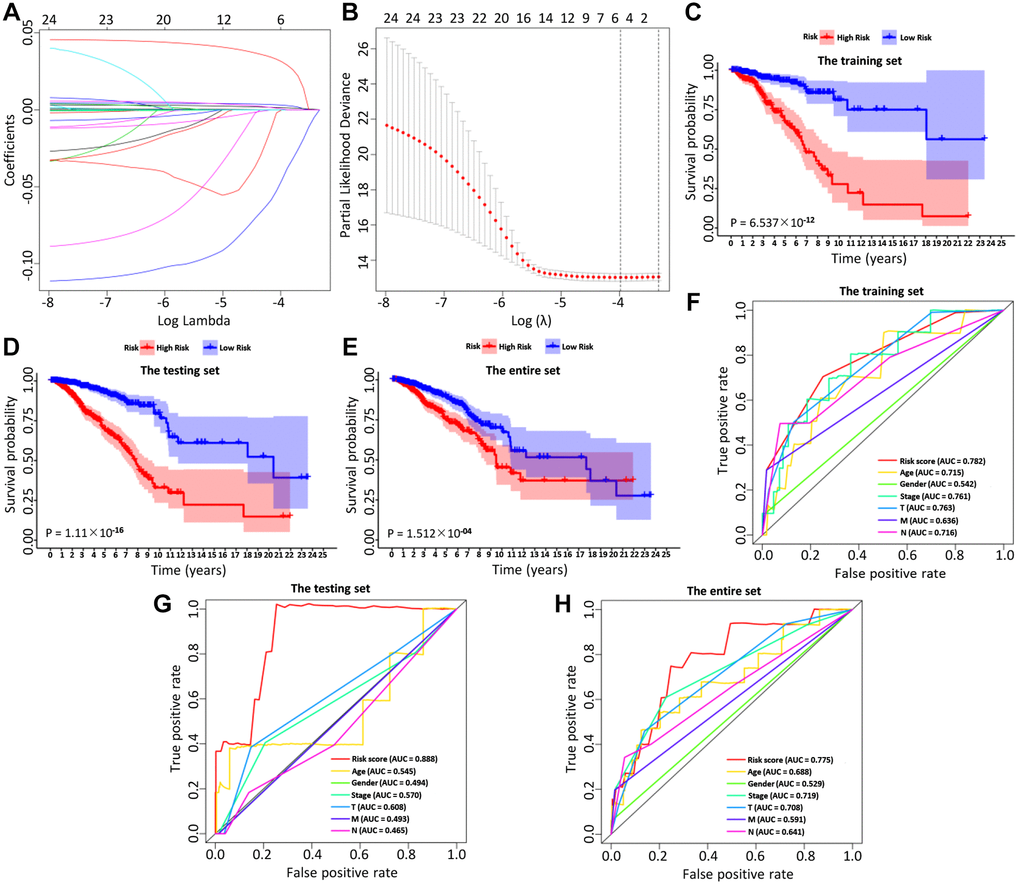
Figure 3.The LASSO coefficient profiles about 6 immune-related genes were shown in (A, B). The lower X-axis indicated log (λ), the upper X-axis indicated the average number of OS-related genes, and the Y-axis showed the partial likelihood deviance error. Red dots indicated the average partial likelihood deviances about the model with a given λ, the vertical bars represented the range of the partial likelihood deviance errors, and the vertical black dotted lines meant the best fit with the optimal λ values. The training set (C), the testing set (D) and the entire set (E) showed the survival curves of high-risk group and low-risk group respectively. The survival-dependent receiver operating characteristic (ROC) curves prognostic value in 1 year of the three sets were shown in the (F–H).