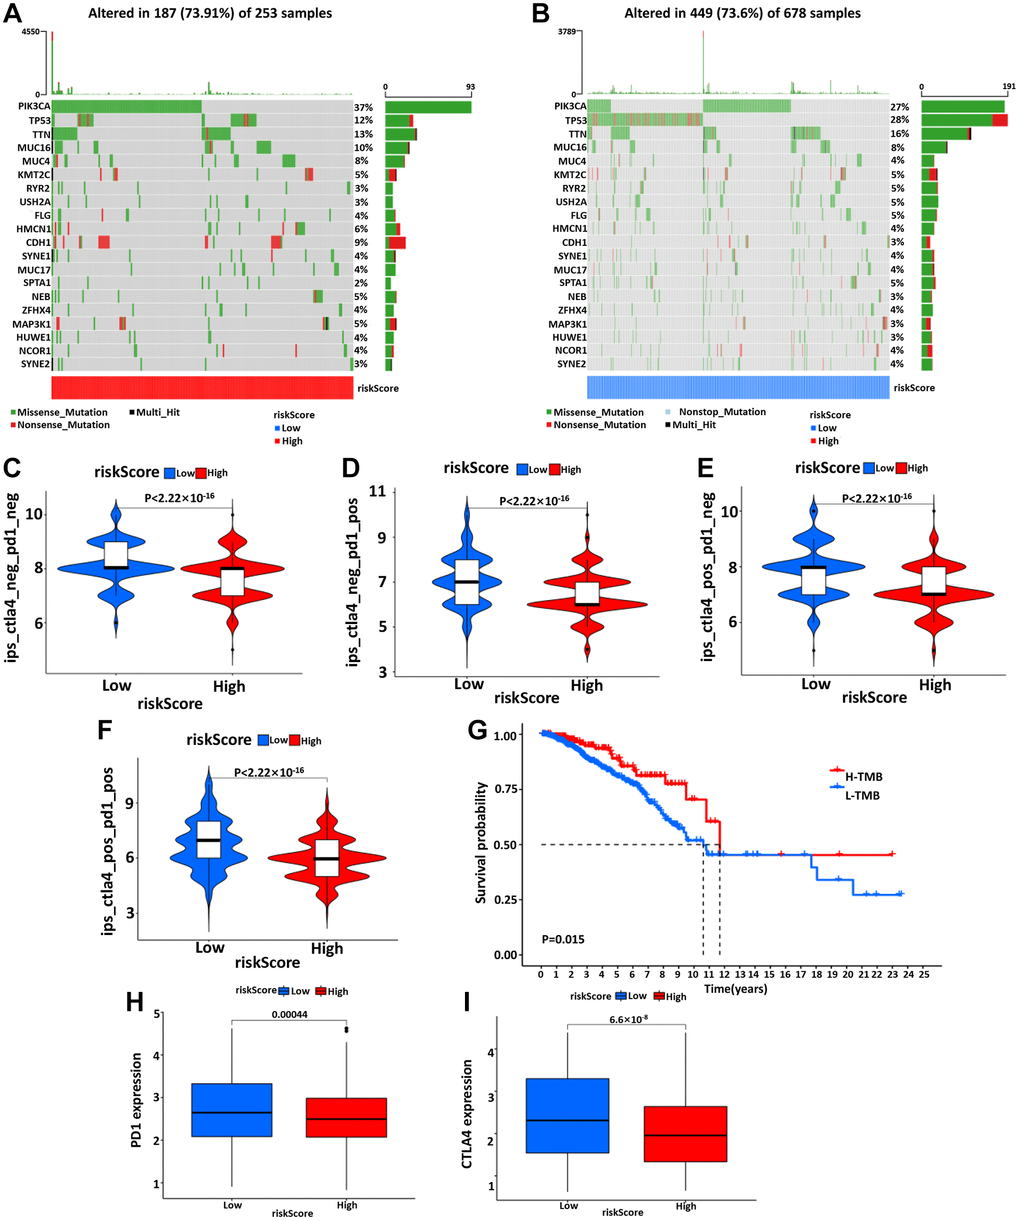
Figure 7.The waterfall diagram of tumor somatic mutation in patients with high- (A) and low- (B) risk groups. (C–F) The association between IPS and the risk model, the IPS, IPS-PD1, IPS-CTLA4, and IPS-PD1/CTLA4 scores were significantly increased in the low-risk group. Kaplan-Meier curve was used to analyze the survival of the high and low TMB load (G). The results showed that the survival of the two cohorts with high and low TMB load was significantly different. (H, I) Wilcoxon test was used to analyze the difference of PD1 and CTLA4 expression between high- and low-risk groups.