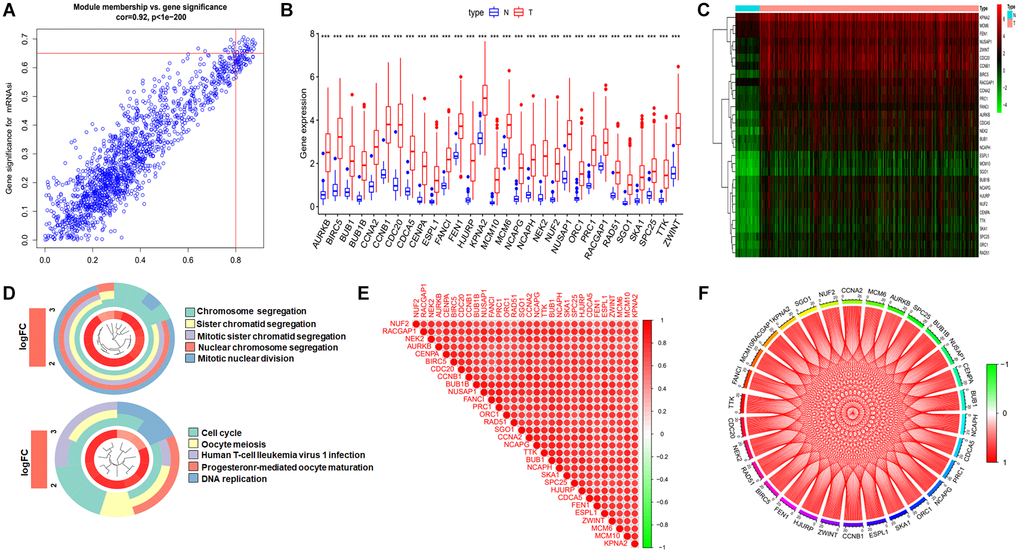
Figure 3.Identification the key genes and expression, functional enrichment and correlation analysis of these genes. (A) Scatter plot of maximum positive correlation with cancer stemness index (mRNAsi). (B and C) Box plot of the difference in expression of key genes between tumor and normal tissue. (D) Functional enrichment analysis of key genes. (E and F) Analysis of the correlation of key genes at the transcriptional level, red represents for positive correlation and green represents for negative correlation.