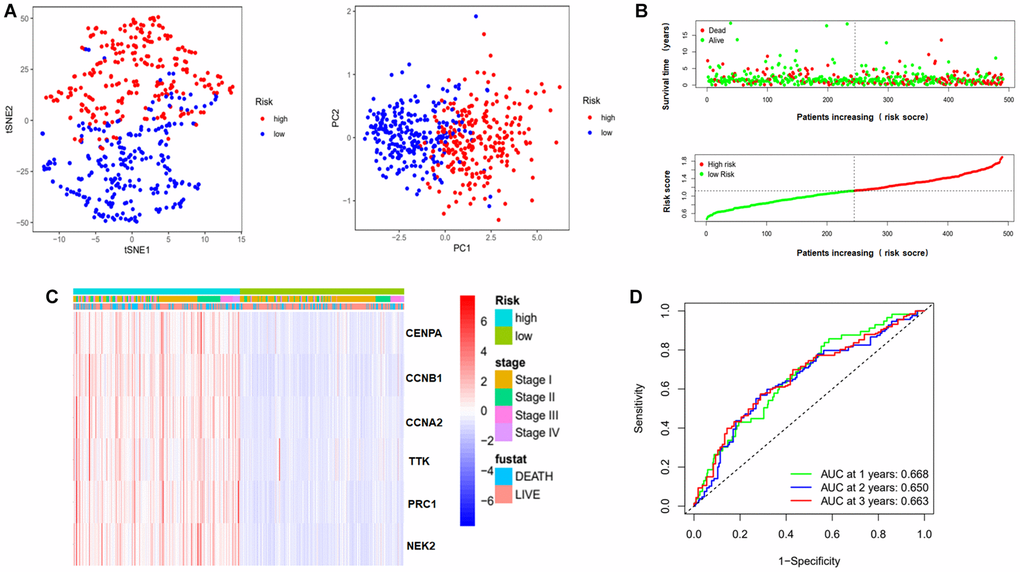
Figure 6.Evaluation of risk model. (A) PCA and t-SNE analysis to assess the sample of the risk model. Red dots represent high risk group, blue dots represent low risk group. (B) Risk score maps and survival status maps of patients in the high and low risk groups. In the survival status map, red dots represent death, green dots represent survival. In the risk score maps, green represents low risk and red represents high risk. (C) Clinical heat map representing the relationship between risk genes and clinical characteristics. (D) ROC curves to evaluate the prognostic effect of this model on overall survival at 1, 2, 3 years. Abbreviations: t-SNE: t-distributed stochastic neighbor embedding; PCA: Principal Component Analysis; AUC: area under the curve; ROC: receiver operating characteristic curve.