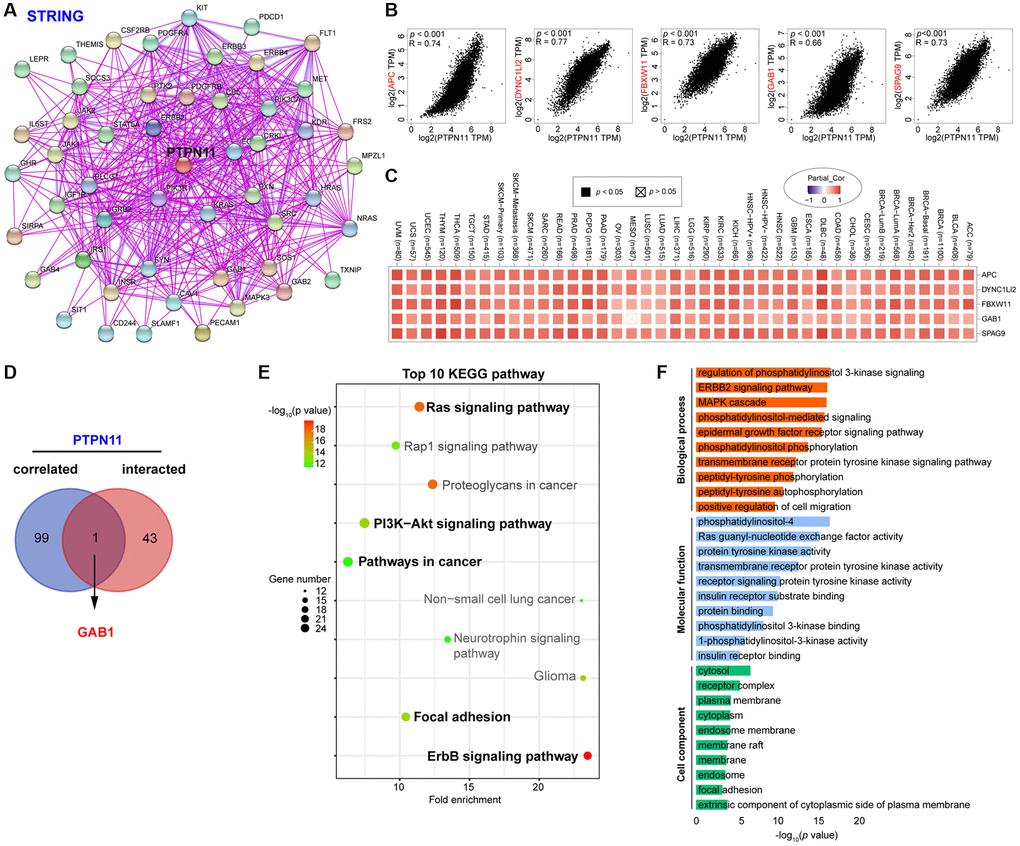
Figure 10.Enrichment and pathway analysis of PTPN11-related genes. (A) An experimentally validated network of interactions between PTPN11-binding proteins, as determined by STRING. (B) Expression association between PTPN11 and representative genes (APC, DYNC1LI2, FBXW11, GAB1, and SPAG9) among the top PTPN11-correlated genes identified by GEPIA2. (C) Correlation map of PTPN11 and APC, DYNC1LI2, FBXW11, GAB1, and SPAG9 expression in TCGA cancers. (D) Using a Venn diagram, only GAB1 was detected in both datasets of PTPN11-binding and associated genes. (E) KEGG pathway evaluation of PTPN11-binding and interacted genes. (F) Enrichment analysis of GO terms for PTPN11-binding and interacted genes.