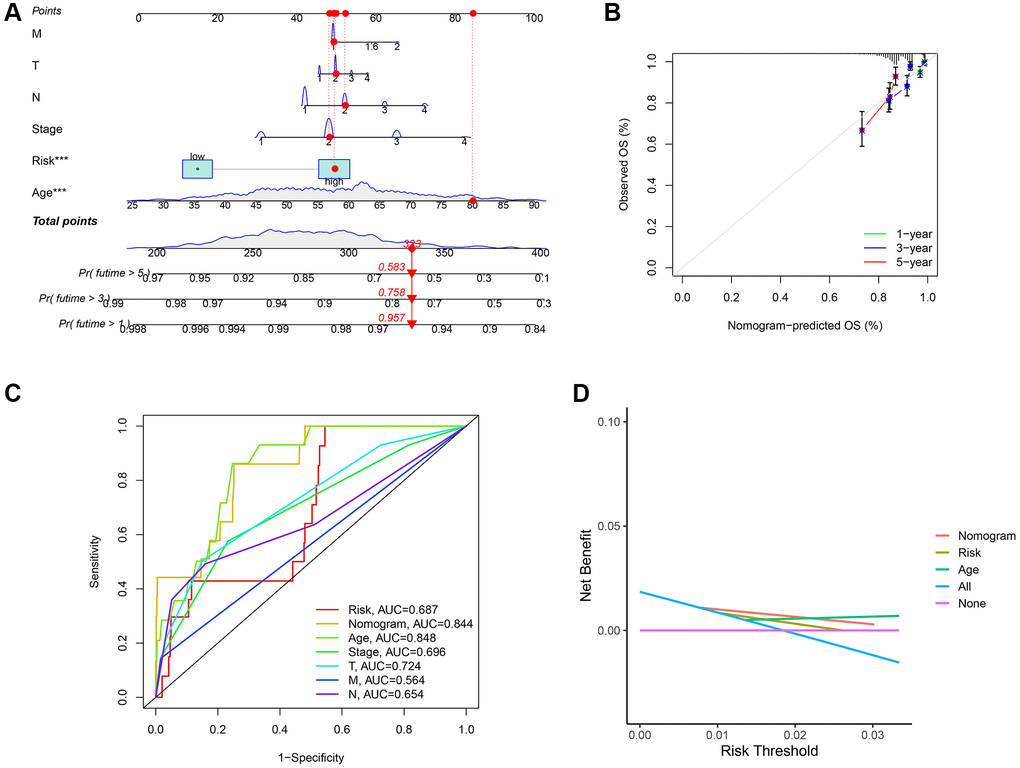
Figure 7.Establishment of nomogram model and calibration curves. (A) The predictive nomogram. (B) The calibration curves of the nomogram. (C) Receiver operating characteristic (ROC) curve analysis of the clinicopathological manifestations and nomogram. (D) The decision curve analyses (DCA) plot.