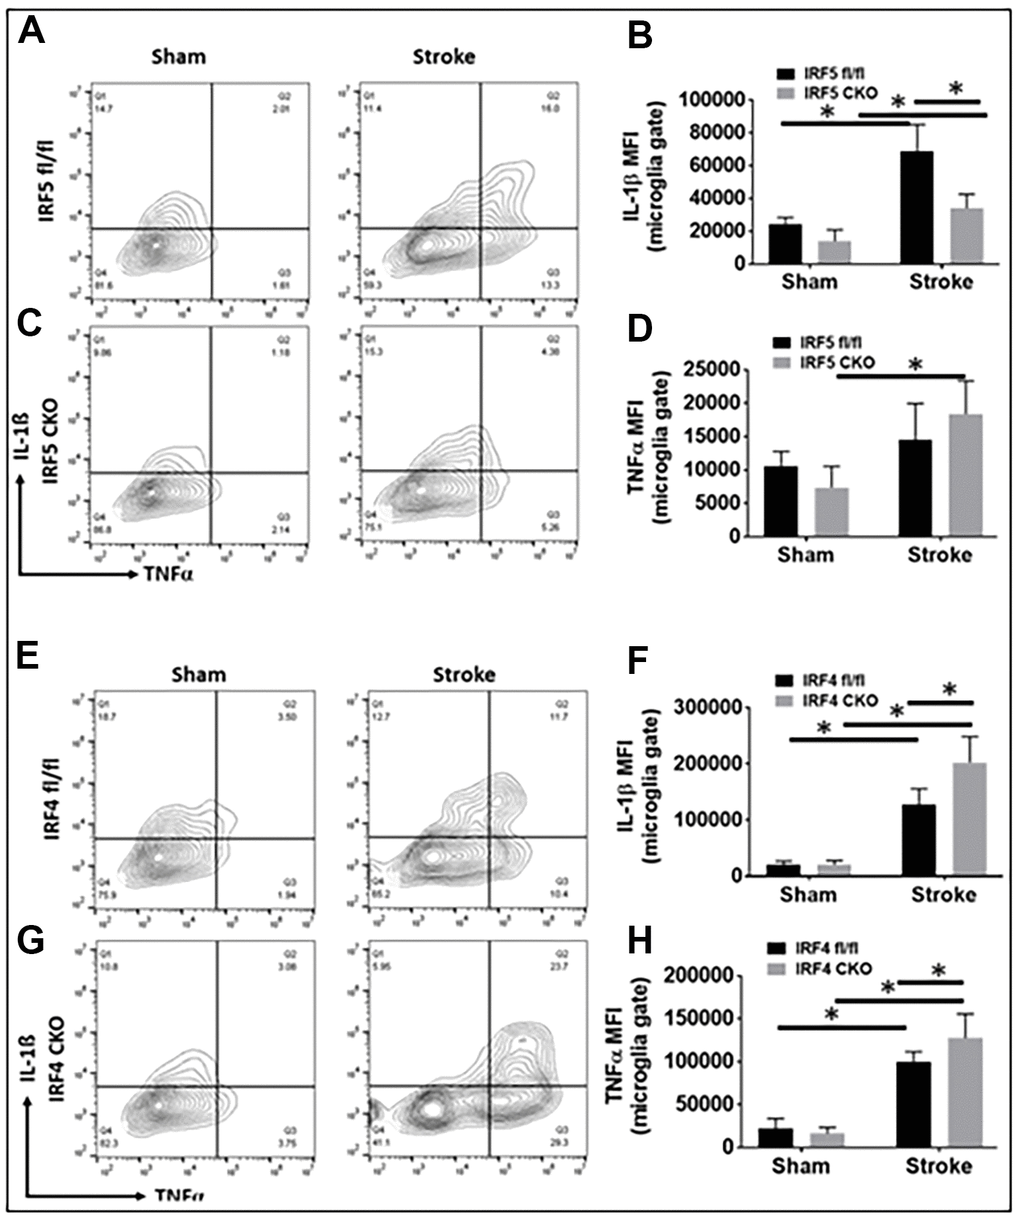
Figure 3.Intracellular cytokine levels in IRF5 or IRF4 CKO vs. flox microglia by flow cytometry performed on stroke and sham brains. Quantification data are presented as mean MFI. (A–D) Data of IRF5 CKO and (E–H) data of IRF4 CKO microglia, respectively. (A, C) are representative intracellular staining plots for IL-1β/TNF-α in both IRF5 CKO and flox microglia; (E, G) are plots for IL-1β/TNF-α in both IRF4 CKO and flox microglia. MFI of these cytokines were quantified in (B, D, F, H). n = 4 to 5 per sham and 6 to 7 per stroke group; *P < 0.0500.