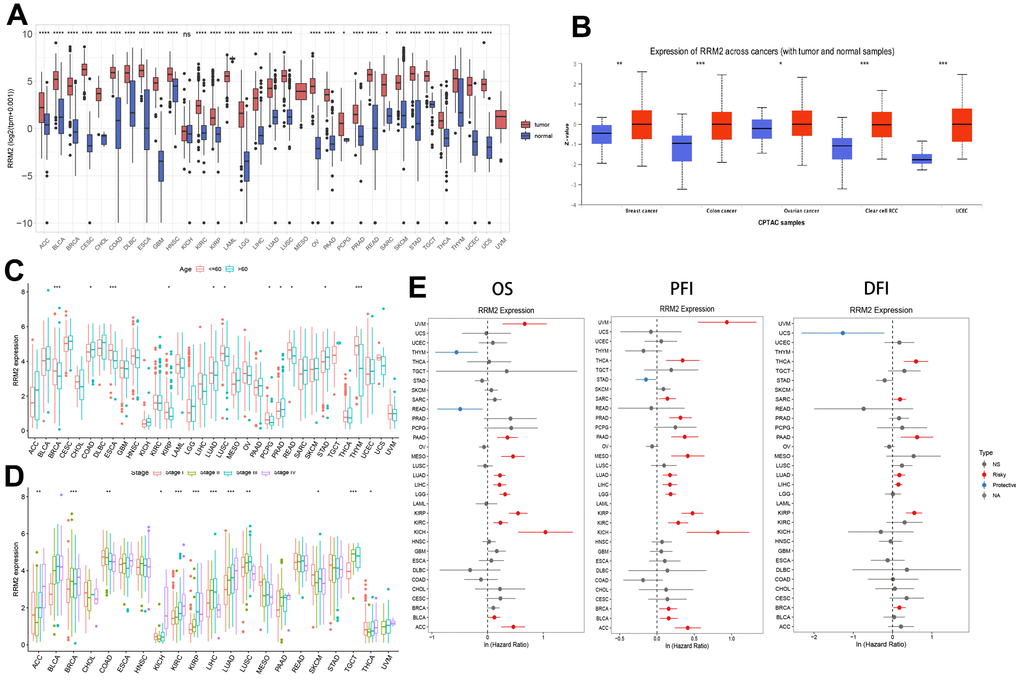
Figure 1.RRM2 gene expression levels in different tumors and clinical data of cancer patients obtained from TCGA. (A) RRM2 gene expression levels in different cancer types and normal tissue from the TCGA and GTEx datasets. The red rectangle box represents the gene expression level in tumor tissue and the blue rectangle box in normal tissue. (B) Protein expression of RRM2 in breast cancer, ovarian cancer, colon cancer, clear cell RCC, and UCEC. The red rectangle box represents protein expression levels in tumor tissue and the blue one in normal tissue. (C) The RRM2 gene expression levels in patients belonging to different age groups. The red rectangle box indicates the RRM2 gene expression level in patients aged less than or equal to 60 years. The blue rectangle box indicates the RRM2 gene expression level in patients aged greater than 60 years. (D) The RRM2 gene expression levels in different tumors belonging to different pathological stages. The red rectangle box indicates the RRM2 gene expression level in stage I, the green one in stage II, the blue one in stage III, and the purple one in stage IV tumors. (E) Correlation analysis of RRM2 gene expression with OS, PFI, and DFI by the Cox regression analysis method in different types of cancers. * P < 0.05; ** P < 0.01; *** P < 0.001; **** P < 0.0001.