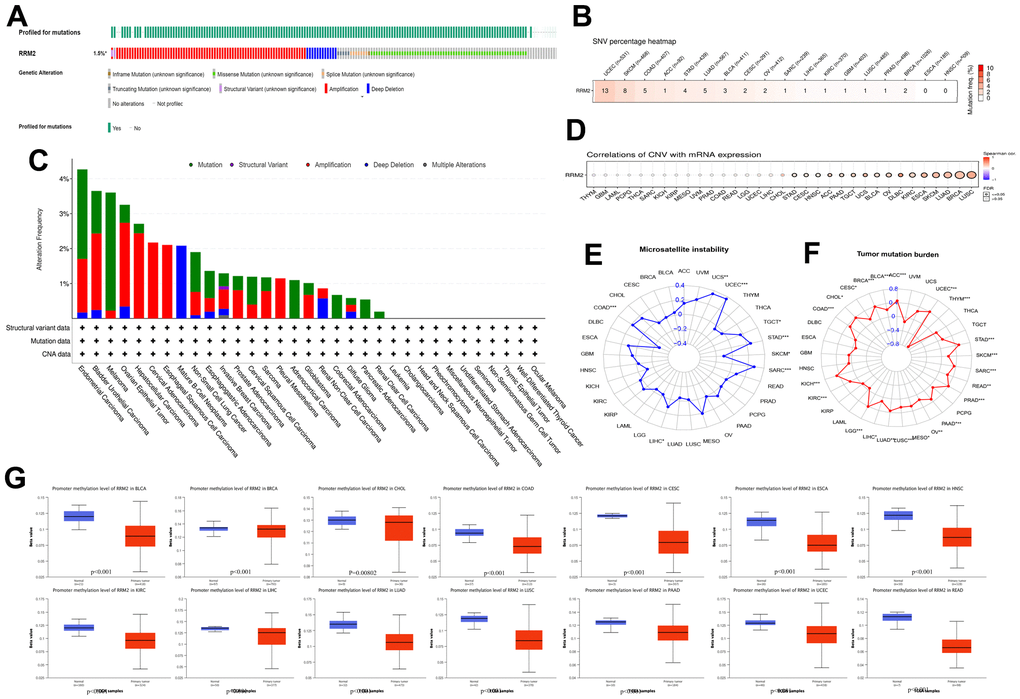
Figure 2.Genetic alteration in RRM2. (A) OncoPrint visual summary of alteration based on a query of RRM2. The green color represents mutation sites on a query of the RRM2 gene. (B) The SNVs percentage profile of RRM2. The color in each small rectangle represents the mutation frequency in different types of cancers; the red and white indicate the high and low mutation frequency, respectively. (C) The alteration frequency of RRM2 with mutation type in different tumors. (D) CNV Pearson’s correlation between CNV and RRM2 mRNA expression. (E) Radar map of correlation between RRM2 expression and MSI. The value in black denotes the range, and the curve in red the correlation coefficient. (F) Radar map of correlation between RRM2 expression and TMB. The value in black reveals the range, and the curve in blue the correlation coefficient. (G) Analysis of promoter methylation levels of RRM2 in different tumors. *P < 0.05, **P < 0.01, ***P < 0.001.