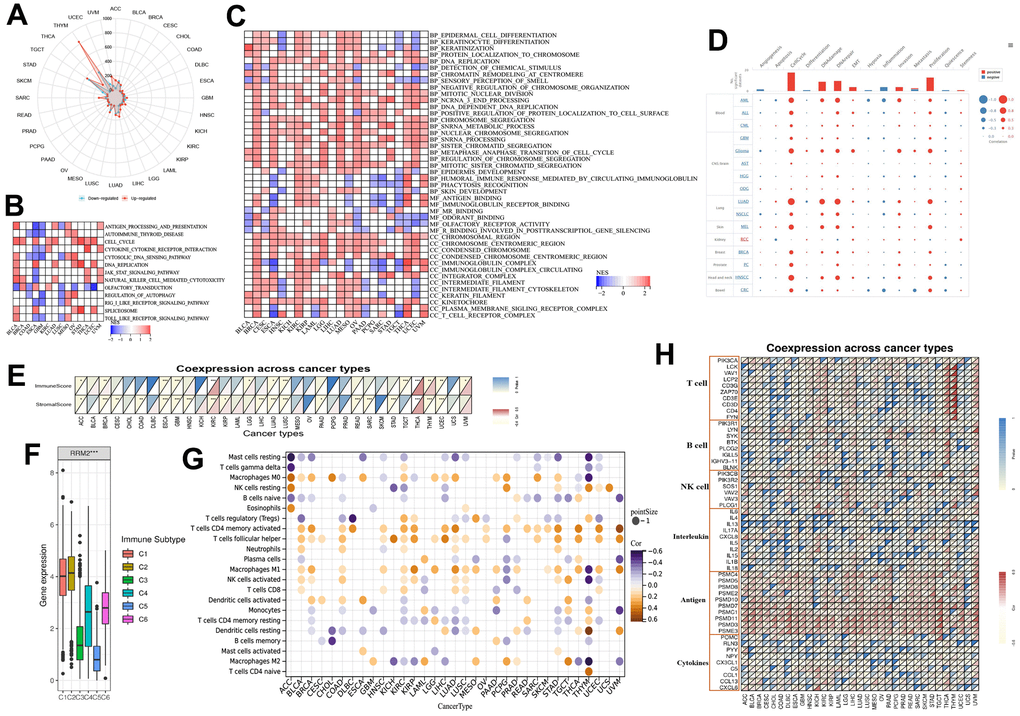
Figure 5.RRM2-associated biological functions and immune signatures. (A) The DEGs between the high- and low-RRM2 expression groups in different tumors. (B) The heatmap of gene KEGG analysis of DEGs. (C) The heatmap of GO analysis of DEGs between high- and low-RRM2 expression group. (D) Average correlations between RRM2 and functional status in different cancers and the bar chart indicating the number of datasets in which RRM2 is significantly related to the corresponding state for single-cell resolution. (E) RRM2 gene expression associated with stromal and immune scores in different cancers. (F) RRM2 gene expression levels in different immune subtypes. The X-axis represents the immune subtype; Y-axis gene expression. C1, wound healing; C2, IFN-g dominant; C3, inflammatory; C4, lymphocyte depleted; C5, immunologically quiet; C6, TGF-b dominant. (G) Correlation of RRM2 gene expression with immune cell infiltration levels in 33 types of tumors (p < 0.05). (H) Correlation of RRM2 gene expression with immune factors across human cancers. *: P-value <= 0.05; FDR <= 0.05.