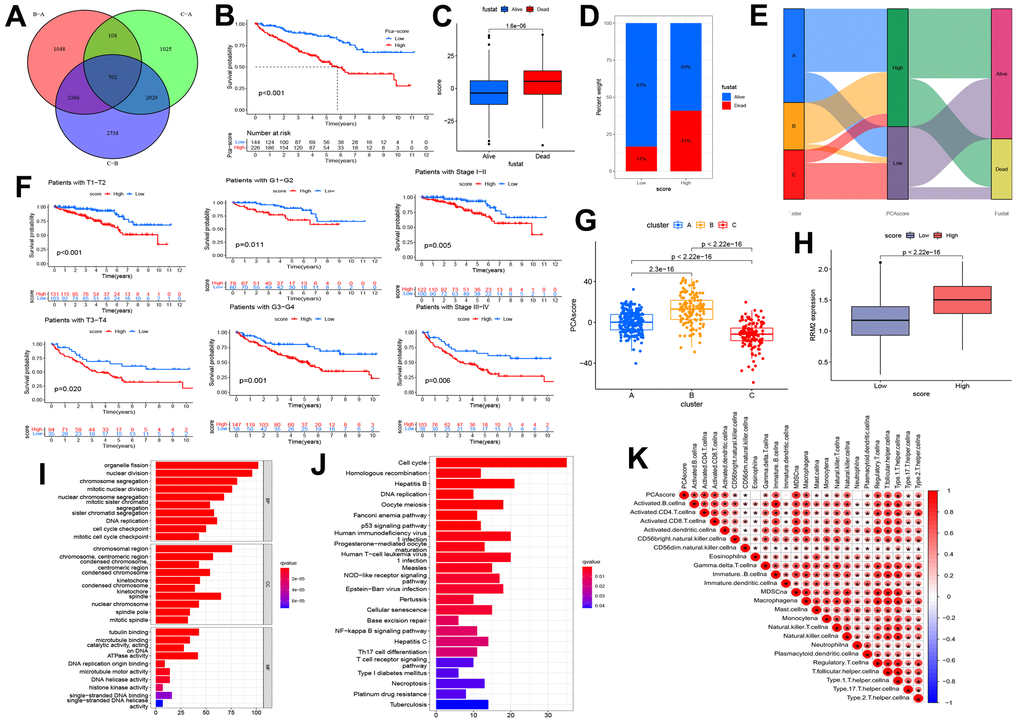
Figure 7.Construction of the risk score and exploration of its clinical relevance. (A) The Venn diagram of differential expression genes (DEGs) in three clusters. (B) Kaplan-Meier curves indicating the overall survival probability between two risk score groups. (C, D) Association of risk score with survival outcome. (E) Sankey diagram depicting the association of score groups with clusters, gene clusters, and survival outcome. (F) Kaplan-Meier curves demonstrating the overall survival probability in different clinical features. (G) The risk score difference between cluster A, cluster B, and cluster C. (H) High-and low-score groups are associated with the expression level of RRM2. (I) The GO analysis of prognostic DEGs. (J) KEGG analysis of prognostic DEGs. (K) The correlation between the risk score and immune cells.