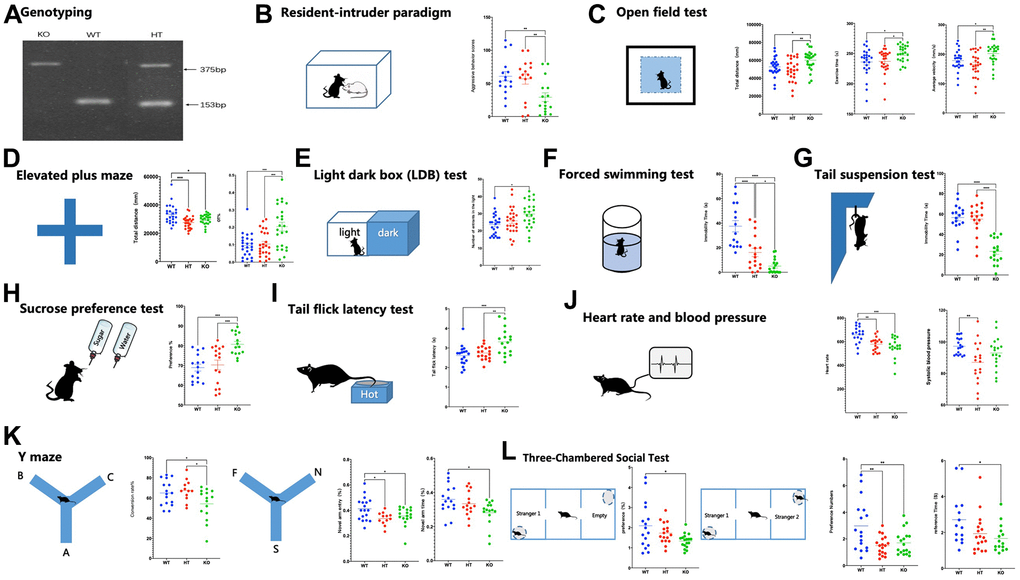
Figure 1.Genotyping, affective symptoms, and PMDD-like behaviors of mice. (A) Mouse genotyping using primers specific for the Gabrb2 and Neo genes. (B) Resident-intruder paradigm showing aggressive behavior scores of mice (WT male = 16, HT male= 16, KO male=16). (C) Open field test showing total distance, total distance in the central area, and total time in the central area (WT male =24, HT male=25, KO male=24). (D) Elevated plus maze showing percentile entries and time into open arms (WT male =24, HT male=25, KO male=24). (E) Light dark box (LDB) test showing entries and time into lightbox (WT male = 18, HT male= 18, KO male= 18). (F) Forced swimming test showing immobility time of mice suspended in the water (WT male =15, HT male=17, KO male=17). (G) Tail suspension test showing immobility time of mice suspended by the tail to a horizontal bar (WT male =17, HT male=17, KO male=17). (H) Sucrose preference test showing (WT male =15, HT male=16, KO male=15). (I) Tail flick latency test showing (WT male =18, HT male= 17, KO male=16). (J) Heart rate and blood pressure (WT male =18, HT male=18, KO male=18). (K) Y maze contains two parts: spontaneous alternation and novelty arm, showing percentile time spent in, or entries into, the novel arm was monitored to measure spatial-working memory (WT male =18, HT male=12, KO male= 17). (L) Three-Chambered Social Test contains two parts: social affiliation and social novelty, showing a preference for the container holding a stranger mouse relative to an empty container; and preference for social novelty: preference for the container holding a Stranger-2 mouse relative to the container holding Familiar-1 mouse (WT male =18, HT male=18, KO male= 18). Statistical analysis was performed using one-way ANOVA with Newman–Keuls post-hoc test. Average y values ± SEM in the different plots are represented by horizontal bars. *p < 0.05, **p < 0.01, ***p < 0.001.