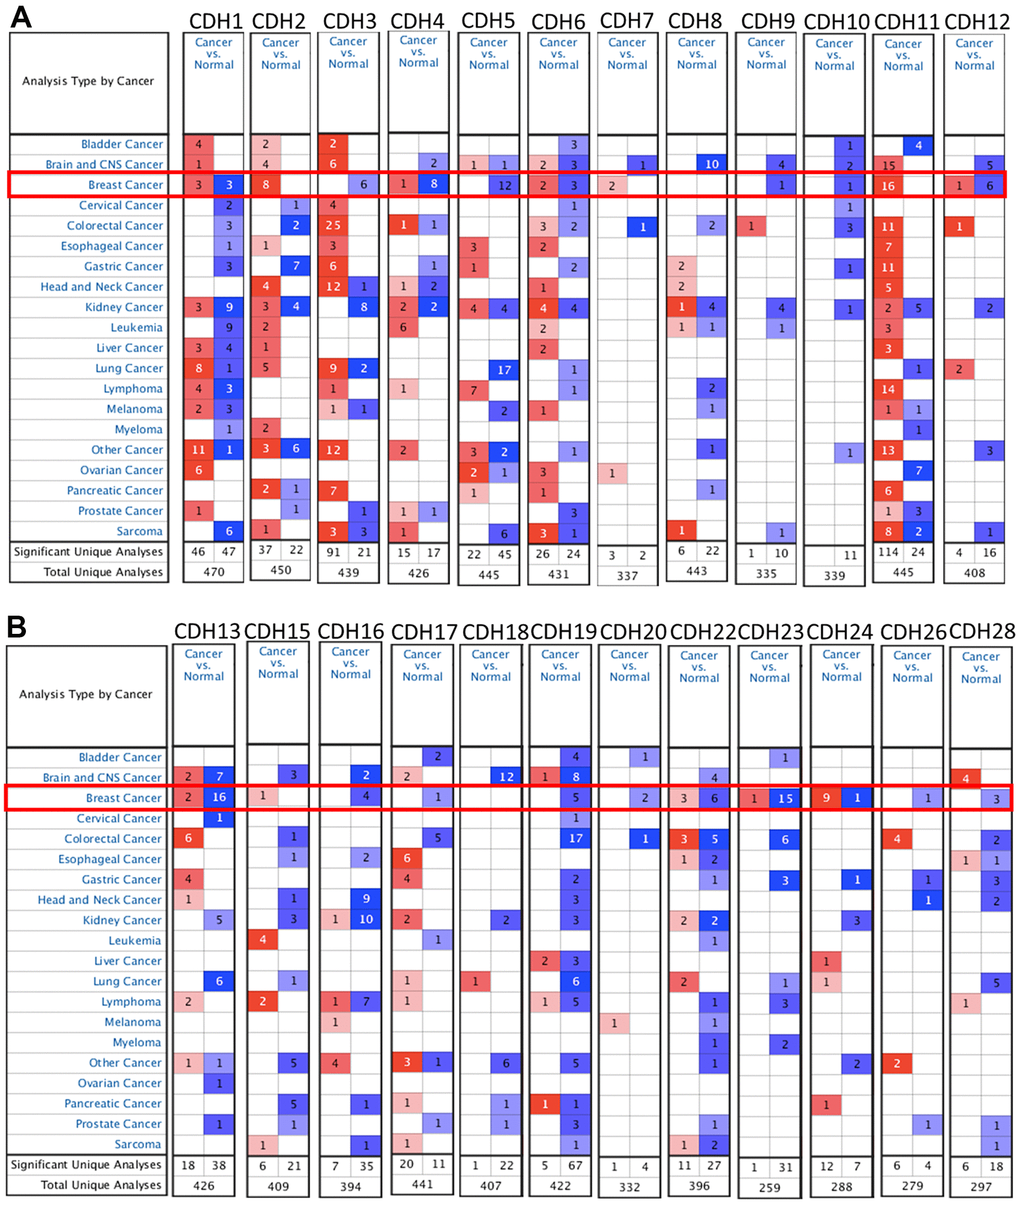
Figure 2.mRNA transcription levels of cadherin (CDH) gene family members (ONCOMINE). A red background with numbers indicates studies including expression levels of CDH family members corresponding to our selection standards (with p values <0.05, fold changes of >1.5, and the expressed gene rank in the top 10% as selection thresholds) in cancer tissues; blue (the same selection threshold) in normal tissues. The number for the significant unique analyses means that the queried genes significantly differed in these studies. The number for the total unique analyses means the total number of queried genes in these studies. (A) mRNA transcription levels of CDH1/2/4/6/7/11/12 were overexpressed in breast cancer samples compared to normal tissues, while transcriptional levels of CDH1/3/4/5/6/9/10/12 were downregulated compared to normal tissues. (B) mRNA transcription levels of CDH13/15/22/23/24 were overexpressed in breast cancer samples compared to normal tissues, while transcriptional levels of CDH13/16/17/19/20/22/23/24/26/28 were downregulated compared to normal tissues. Red indicates upregulation, and blue indicates downregulation compared to normal tissues.