


Introduction
Breast cancer is one of the most common malignancies among women and the second leading cause of death after lung cancer [1, 2]. The prognosis of breast cancer is better with early detection and improved treatment. Because of the poor prognosis of advanced breast cancer, research on breast cancer has recently focused on precise detection of invasion and metastasis with accurate tumorigenic biomarkers [3–9]. Despite progress in developing diagnostic screening tools, distant metastases at the time of diagnosis indicates a worse prognosis with only 23% of patients surviving 5 years post-diagnosis [10]. Therefore, novel research on genetic alterations and signal transduction pathways is playing important roles in both early breast cancer detection and treatment in advanced stages [11–13].
The cadherins (CDHs) are a superfamily of calcium-dependent adhesion molecules which have functions in cell recognition, tissue morphogenesis, and tumor suppression [14, 15]. The CDH family consists of 23 members, from CDH1 to CDH26, as documented in the GeneCards database [16]. Basic characteristics of the CDH gene family, including gene IDs and aliases, are presented in Table 1. Classic cadherins have mostly been thoroughly studied, including epithelial (E)-cadherin (CDH1), neural (N)-cadherin (CDH2), placental (P)-cadherin (CDH3), and retinal (R)-cadherin (CDH4) [17].
Table 1. Basic characteristics of the CDH gene family.
| Approved symbol | HGNC ID | Gene ID | Aliases | Location on chromosome |
| CDH1 | 1748 | 999 | Cadherin 1; Uvomorulin; CD324; UVO; Cadherin 1, Type 1, E-Cadherin (Epithelial) | 16q22.1 |
| CDH2 | 1759 | 1000 | Cadherin 2; CDHN; CD325; NCAD; Cadherin 2, Type 1, N-Cadherin (Neuronal) | 18q12.1 |
| CDH3 | 1762 | 1001 | Cadherin 3; CDHP; PCAD; Cadherin 3, Type 1, P-Cadherin (Placental) | 16q22.1 |
| CDH4 | 1763 | 1002 | Cadherin 4; R-Cadherin; Cadherin 4, Type 1, R-Cadherin (Retinal) | 20q13.33 |
| CDH5 | 1764 | 1003 | Cadherin 5; VE-Cadherin; CD144; 7B4 | 16q21 |
| CDH6 | 1765 | 1004 | Cadherin 6; Cadherin 6, Type 2, K-Cadherin (Fetal Kidney) | 5p13.3 |
| CDH7 | 1766 | 1005 | Cadherin 7; Cadherin 7, Type 2; Cadherin-7; CDH7L1 | 18q22.1 |
| CDH8 | 1767 | 1006 | Cadherin 8; Cadherin 8, Type 2; Cadherin-8; Nbla04261 | 16q21 |
| CDH9 | 1768 | 1007 | Cadherin 9; Cadherin-9; Cadherin 9, Type 2 (T1-Cadherin) | 5p14.1 |
| CDH10 | 1749 | 1008 | Cadherin 10; Cadherin-10; T2-Cadherin; Cadherin 10, Type 2, (T2-Cadherin) | 5p14.2-p14.1 |
| CDH11 | 1750 | 1009 | Cadherin 11; CAD11; OB; Cadherin 11, Type 2, OB-Cadherin (Osteoblast) | 16q21 |
| CDH12 | 1751 | 1010 | Cadherin 12; Br-Cadherin; CDHB; Neural Type Cadherin 2 | 5p14.3 |
| CDH13 | 1753 | 1012 | Cadherin 13; CDHH; T-Cadherin; H-Cadherin (Heart) | 16q23.3 |
| CDH15 | 1754 | 1013 | Cadherin 15; CDH 14; CDH3; Cadherin 15, Type 1, M-Cadherin (Myotubule) | 16q24.3 |
| CDH16 | 1755 | 1014 | Cadherin 16; Cadherin 16, KSP-Cadherin; Kidney-Specific Cadherin | 16q22.1 |
| CDH17 | 1756 | 1015 | Cadherin 17; HPT-1; Intestinal Peptide-Associated Transporter HPT-1 | 8q22.1 |
| CDH18 | 1757 | 1016 | Cadherin 18; CDH14; Cadherin 18, Type 2 | 5p14.3 |
| CDH19 | 1758 | 28513 | Cadherin 19; CDH7; Cadherin 19, Type 2 | 18q22.1 |
| CDH20 | 1760 | 28316 | Cadherin 20; CDH7L3; Cdh7 | 18q21.33 |
| CDH22 | 13251 | 64405 | Cadherin 22; DJ998H6.1; C20orf25 | 20q13.12 |
| CDH23 | 13733 | 64072 | Cadherin 23; CDHR23; Cadherin-Related Family Member 23 | 10q22.1 |
| CDH24 | 14265 | 64403 | Cadherin 24; CDHH11L; Cadherin 24, Type 2 | 14q11.2 |
| CDH26 | 15902 | 60437 | Cadherin 26; VR20; Cadherin-Like Protein VR20 | 20q13.33 |
It is widely accepted that the epithelial-to-mesenchymal transition (EMT) of epithelial cells results in strong cell-cell adhesion and more invasive features [18]. The EMT is essential for this phenomenon and is considered a promoter of metastasis, and metastatic processes associated with mesenchymal features are similar among various cancers such as advanced breast cancer. The EMT has also received a lot of interest in cancer research and is thought to be an important step in metastases [19, 20]. As a result, finding new molecules that can inhibit this mechanism is an important subject of scientific study. A feature of the EMT is in part a result of downregulation of CDH1 and parallel upregulation of other cadherins like CDH2, which plays an essential role during early invasion and metastasis [21]. Loss of CDH1 alone might be insufficient to induce the EMT [22]. Instead, CDH1 expression was observed in invasive lobular carcinomas (ILCs) and invasive ductal carcinomas (IDCs) [23]. Other cadherins and molecules such as β-catenin, which forms an important membrane complex, are often detached from the cell membrane and are translocated to the nucleus to induce EMT signaling events [24–26].
Previous studies reported the roles of cadherins in breast cancer. However, interactions and pathways among all CDH family members and related molecules in tumorigenesis are still unclear, and challenges remain in discovering suitable biomarkers for precision treatment and detection.
The present study is the first study to perform a bioinformatics analysis of the entire CDH family in patients with breast cancer by analyzing several large online databases. A flowchart depicting the investigative strategies we utilized in this study, including expression levels, clinical survival, and functional enrichment analyses, of CDH family members in breast cancer is presented in Figure 1. First, original data were retrieved from the Molecular Taxonomy of Breast Cancer International Consortium (METABRIC) and The Cancer Genome Atlas (TCGA) databases. Second, differential expression levels were analyzed using the Oncomine and Tumor Immune Estimation Resource (TIMER) databases. Third, Kaplan-Meier (KM) plots were utilized to reveal the significance of CDH family in the prognosis of breast cancer patients. Incorporating these results, we selected targeted genes due to higher expression levels and lower survival for further analysis. Then, the Cancer Cell Lines Encyclopedia (CCLE) and Gene Expression Profiling Interactive Analysis 2 (GEPIA2) databases were used to discover differences in expressions between breast cancer and normal tissues [27–31]. Afterwards, we used the MethSurv database to determine single CpG methylation expression patterns. In addition, we studied the gene potential thoroughly through a functional enrichment analysis and micro (mi)RNA-regulated networks, including biological processes (BPs), cellular components (CCs), molecular functions (MFs), signaling pathways, and potentially regulated miRNAs. Ultimately, we utilized the TIMER2.0 database to uncover correlations between CDH genes and immune cell markers in breast cancer. The flowchart is presented to offer insights into our comprehensive approach and possibly suggest a theoretical foundation for future research.
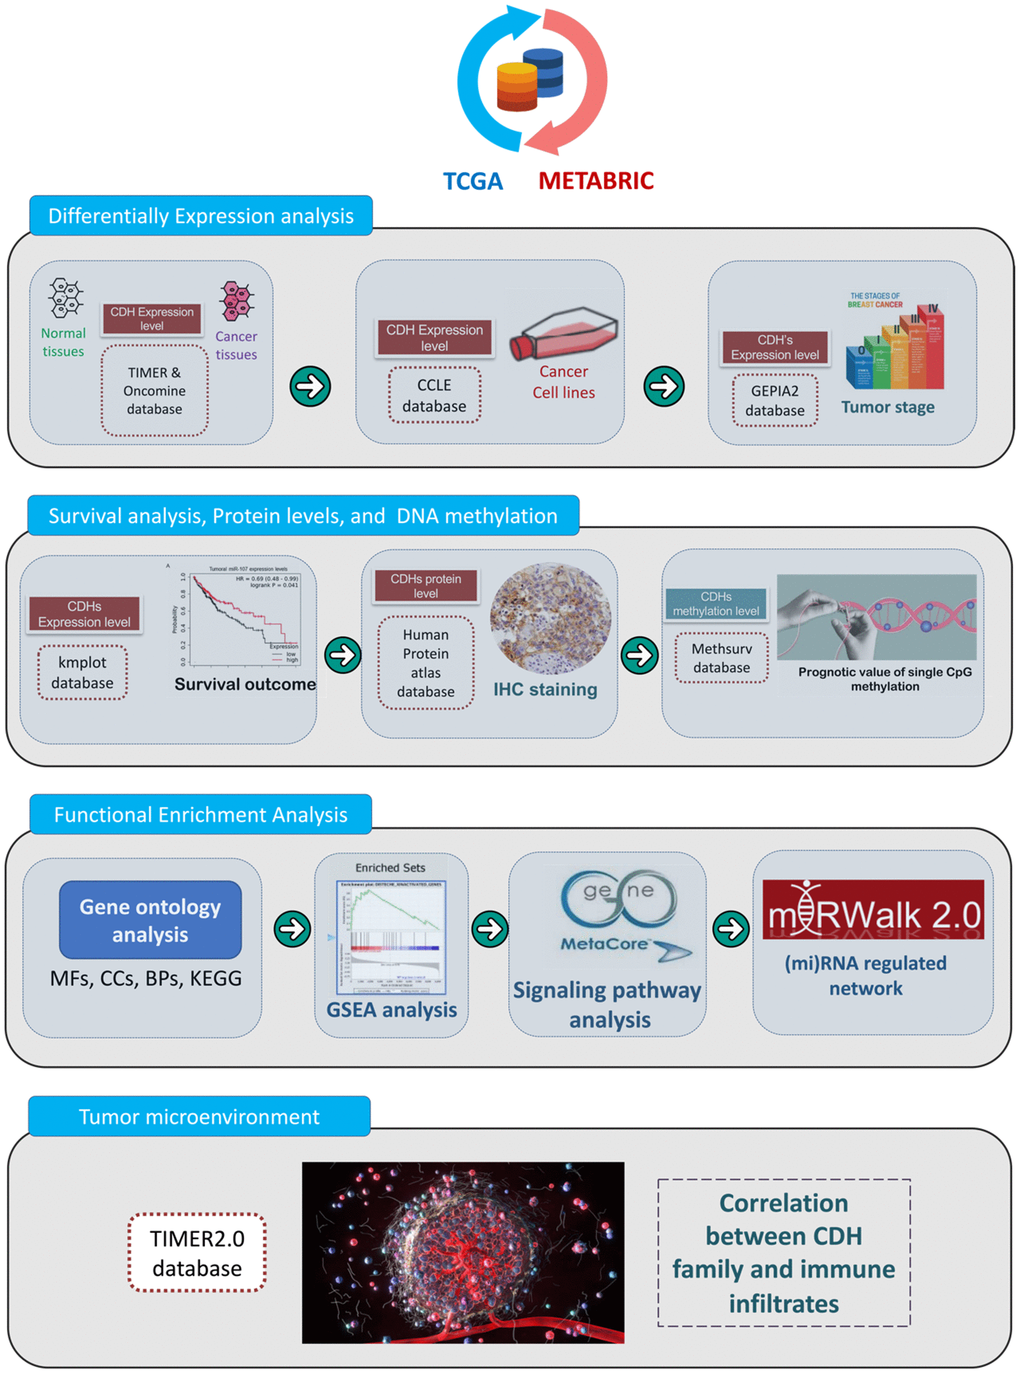
Figure 1. Flowchart of the study design and analytical steps in the present study. Gene data were retrieved from TCGA and METABRIC databases. To select targeted genes among the cadherin (CDH) family, we observed results of simultaneous higher expression levels in cancer cells than normal tissues and poorer prognoses in breast cancer patients. Afterwards, through four steps of a “differential expression analysis”, “survival analysis, protein levels, and DNA methylation”, “functional enrichment analysis”, and “tumor microenvironment”, a comprehensive analysis was conducted with the following databases and analytical methods. TCGA, The Cancer Genome Atlas; METABRIC, Molecular Taxonomy of Breast Cancer International Consortium; TIMER, Tumor IMmune Estimation Resource; CCLE, Cancer Cell Line Encyclopedia; GEPIA2, Gene Expression Profiling Interactive Analysis 2; KM, Kaplan-Meier; IHC, immunohistochemistry; BPs, biological processes; MFs, molecular functions; CCs, cellular components; KEGG, Kyoto Encyclopedia of Genes and Genomes; GSEA, Gene Set Enrichment Analysis; miRNA, micro-RNA.
Materials and Methods
Oncomine analysis
Oncomine (https://www.oncomine.com/) is an online database established to show information of gene expressions in major cancers compared to their respective normal samples [32]. In this study, individual expression levels of CDH family members in various cancers were obtained from the Oncomine database with p<0.05 and fold change (FC) defined as 1.5 [33–37].
TIMER and GEPIA2 analyses
The TIMER database was utilized to identify complements or regulatory factors that are upregulated or downregulated in tumor samples compared to normal tissues. To analyze differences in gene expressions of each CDH family member between breast cancer and normal tissues, differentially expressed genes (DEGs) in breast invasive carcinoma (BRCA) in TCGA dataset were identified via TIMER. The threshold |log2[FC]| was set to 1, and the value of q was 0.05. GEPIA2 (http://gepia2.cancer-pku.cn/#index) is a web platform that contains RNA sequencing (RNA-Seq) expression data from 9736 tumors and 8587 normal samples from TCGA and GTEx projects [38]. An independent t-test was used to calculate p values, and p<0.05 was considered statistically significant; Pr(>F) < 0.05 was based on Student’s t-test [39–44].
KM plotter survival analysis
The KM plotter (http://kmplot.com/analysis/) contains 54,000 genes associated with survival in 21 types of cancer [45], including breast cancer samples (n=7830), which can be analyzed to examine the effects of CDH gene family members on survival times of patients with breast cancer. Results are presented by plotting the survival curve and hazard ratios (HRs) with 95% confidence intervals (CIs) and log-rank p values [46]. To assess the prognosis of breast cancer patients, distant metastasis-free survival (DMFS) was applied to evaluate the survival of advanced breast cancer patients.
Genetic alterations and protein expression analysis
The cBioPortal (http://www.cbioportal.org/) is an open platform providing large-scale visualization, analysis, and downloading of cancer genomic datasets for various types of cancer [47, 48]. Cancer genome profiles can be obtained by a portal query interface, allowing researchers to explore and compare genetic alterations across samples. This study used the cBioPortal to explore alterations, correlations, and networks of the CDH gene family. CDH family protein expressions were evaluated by the Human Protein Atlas (HPA) platform. HPA contains images of pathologic tissues labeled with antibodies in conjunction with 11,250 human proteins. Microarrays include sections from forty-six normal tissues and more than twenty types of human cancers [49–51]. This study used the HPA to obtain the intensities of labeled antibodies in pathologic malignant tissues. Bar charts represent the quantification of four classifications, “negative”, “weak”, “moderate”, and “strong”, of IHC staining intensities in breast cancer samples with different antibodies.
Expression modules in breast cancer gene-expression analysis
“Breast cancer gene-expression miner” (bc-GenExMiner), which contains published annotated breast cancer transcriptomic data (DNA microarrays [n=11,359] and RNA-Seq [n=4421]), is a breast cancer-associated web portal (http://bcgenex.ico.unicancer.fr) that conducts several differential gene expression analyses. We obtained data from Affymetrix® median probe data. To evaluate the difference in a gene’s expression among different groups, Welch’s test was used. Moreover, Dunnett-Tukey-Kramer’s test was used for two-by-two comparisons (allowing determination of the significance levels but not giving a precise p value) when there were more than three different groups and Welch’s p value was significant. Variant corresponding clinical or pathological data is contained in bc-GenExMiner version 4.5, which stresses that the Expression Module can be utilized for both exploratory and validation purposes [52].
Cancer cell line encyclopedia (CCLE) analysis
Over 1100 cell lines among 37 cancer types are contained in the CCLE database (https://portals.broadinstitute.org/ccle). The CCLE dataset provides extensive genomic data, computational analyses, and visualization [53]. For the present study, we used the CCLE dataset to investigate messenger (m)RNA expression levels of CDH family members to further verify their participation in cancer cell lines [54–57].
DNA methylation analysis
The MethSurv (https://biit.cs.ut.ee/methsurv/) database was utilized to determine single CpG methylation expression patterns and establish a heatmap of the different DNA methylated regions [58]. DNA methylation values are presented as beta values (ranging from 0 to 1). We used the formula of M / (M + U + 100) to calculate each single methylation of CpG, where M and U respectively represent methylated and unmethylated intensity values.
Functional enrichment and miRNA-regulated network analyses
The METABRIC and TCGA datasets in the cBioPortal database were accessed for functional enrichment analyses [59, 60]. There were two parts of the MetaCore analysis (https://portal.genego.com). The first part was to find overlapping genes coexpressed in the two datasets with Venny version 2.1. The second part was to uncover BPs, disease biomarker networks, breast neoplasm signaling pathways, and drug target networks [61–65]. Moreover, a gene ontology (GO) analysis was implemented to discover the functional significance of genes with BPs, MFs, CCs, and the Kyoto Encyclopedia of Genes and Genomes (KEGG) with p values of <0.05 indicating statistical significance [66–70]. Next, we used the median expression of targeted genes and then performed a differential analysis with an algorithm in the “DESeq2” package in R/Bioconductor. After the differential analysis, results were utilized for the gene set enrichment analysis (GSEA) with the Hallmark database [71–73]. Then, we used the “fgsea” packages in R Studio software to evaluate enriched pathways in transcriptional data by the GSEA, and online platform (http://www.bioinformatics.com.cn/) and used “SRplot” for visualization (http://www.bioinformatics.com.cn/srplot) [74, 75]. The level of statistical significance was presented via p values, and a normalized enrichment score (NES) reflected the rank of gene classes. In addition, the gene potential of the CDH family was conducted using the miRWalk database (http://mirwalk.umm.uni-heidelberg.de/) to investigate the regulatory potential of miRNAs and to analyze regulated pathways and networks by an Ingenuity Pathway Analysis (IPA) [76–79].
Cox regression analysis in TIMER
The TIMER web server was accessed for a Cox regression analysis [80, 81]. We used the “Survival” module to explore the clinical significance of covariates in a multivariable Cox proportional hazard model. Clinical factors such as age, gender, ethnicity, and tumor stage and gene expression were covariates in the analysis. TIMER presents Cox regression results including hazard ratios (HRs) and statistical significance. For outputs of the Cox model, Surv(CancerType)~variables is the formula of the user-defined Cox regression model, which is fitted by the function coxph() from the R package ‘survival’. In the results, the coefficient reads as a regression coefficient. The 95% confidence intervals (CIs) are shown.
Data availability
The present study is based on open-source data. Users could download relevant data in public databases for research.
Results
Differential expressions of CDH family members in breast cancer
To understand differences in expressions between breast cancer and normal tissues, all 24 CDH family members were investigated in the Oncomine database (Figure 2A, 2B). Findings of this database revealed that at the transcriptional level, CDH1/2/4/6/7/11/12/13/15/22/23/24 were overexpressed in breast cancer samples compared to normal tissues, while transcriptional levels of CDH1/3/5/8/9/10/16/17/18/19/20/26/28 were downregulated compared to normal tissues. In addition, complement expressions were explored across TCGA database via the TIMER database (Figure 3A). We investigated expression levels of CDH family members in breast cancer cell lines using the CCLE database as well (Figure 3B). Results revealed that expression levels were upregulated or downregulated in BRCA samples compared to non-tumor samples. Compared to normal tissues, expression levels of CDH2/3/4/5/6/7/8/10/11/12/13/15/17/19/20/22/23/24/26 were significantly higher in BRCA tissues. In contrast, expression levels of CDH1/18 were significantly lower in BRCA tissues. The molecular subtypes of cell lines are also shown in Supplementary Figure 1. CDH1 and CDH7 were highly expressed in luminal A cell lines; CDH5 was mostly expressed in human epidermal growth factor receptor-2 (HER2) cell lines; CDH2/3/4/6/11/12/13/15/18/19/22/23 showed high expressions in multiple triple-negative breast cancer cell lines; and other CDH genes showed no specific expressions in molecular subtypes of breast cancer cell lines.
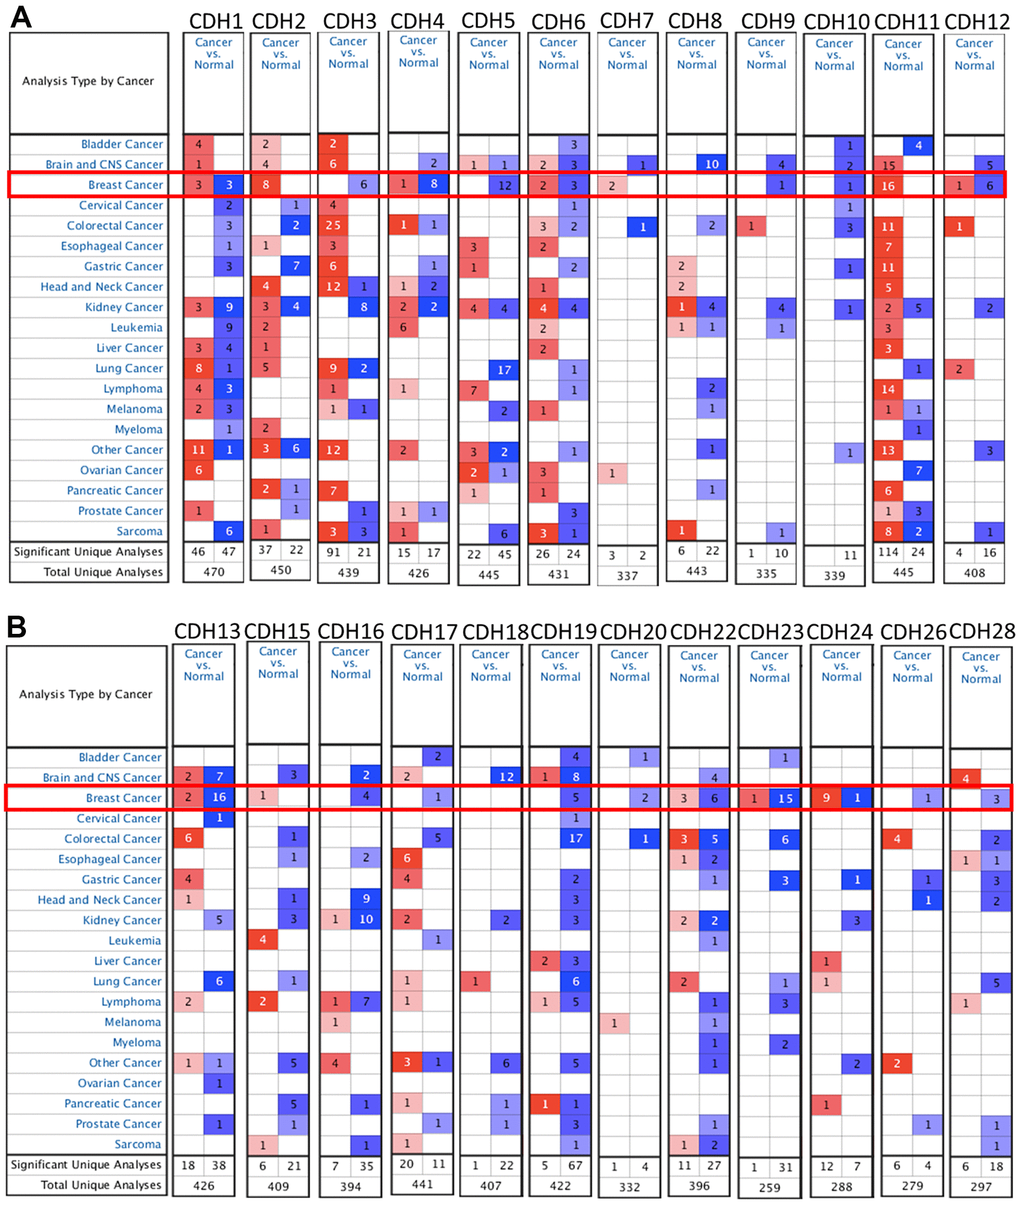
Figure 2. mRNA transcription levels of cadherin (CDH) gene family members (ONCOMINE). A red background with numbers indicates studies including expression levels of CDH family members corresponding to our selection standards (with p values <0.05, fold changes of >1.5, and the expressed gene rank in the top 10% as selection thresholds) in cancer tissues; blue (the same selection threshold) in normal tissues. The number for the significant unique analyses means that the queried genes significantly differed in these studies. The number for the total unique analyses means the total number of queried genes in these studies. (A) mRNA transcription levels of CDH1/2/4/6/7/11/12 were overexpressed in breast cancer samples compared to normal tissues, while transcriptional levels of CDH1/3/4/5/6/9/10/12 were downregulated compared to normal tissues. (B) mRNA transcription levels of CDH13/15/22/23/24 were overexpressed in breast cancer samples compared to normal tissues, while transcriptional levels of CDH13/16/17/19/20/22/23/24/26/28 were downregulated compared to normal tissues. Red indicates upregulation, and blue indicates downregulation compared to normal tissues.
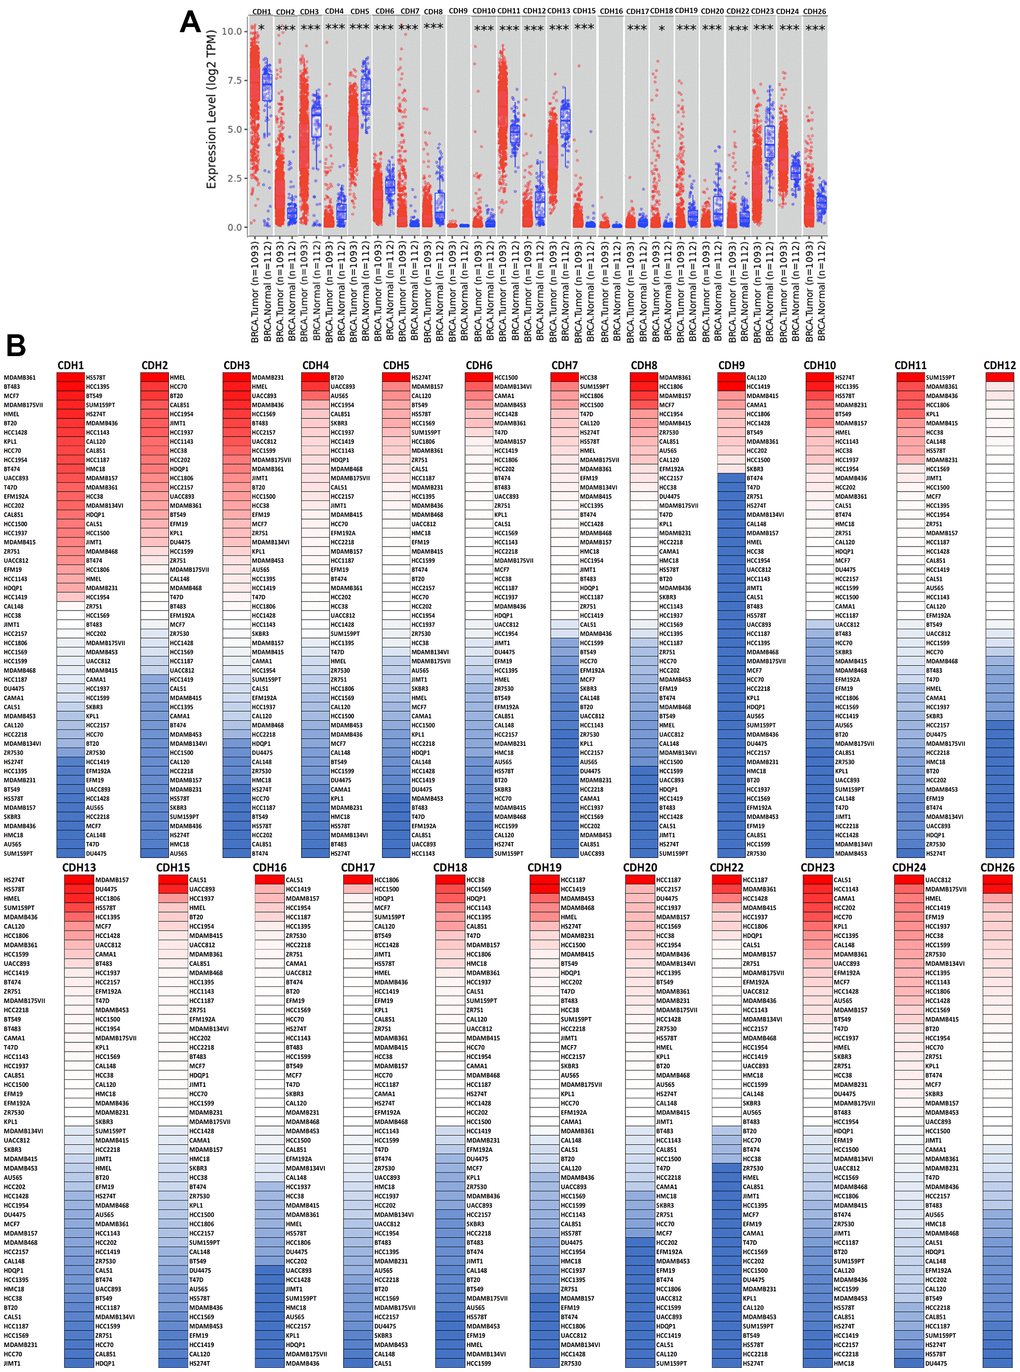
Figure 3. Expression levels of cadherin (CDH) gene family members in breast invasive carcinoma (BRCA). (A) In the TIMER database, a box plot shows transcripts of CDH gene family members in normal and breast cancer tissues. The Wilcoxon test was used to determine statistical significance; * p<0.05, *** p<0.001. (B) Expression levels of CDH gene family members in breast cancer cell lines are represented by a heatmap (CCLE). We used data from the CCLE database to generate mRNA expression values, which were then ranked. In CCLE, red denotes overexpression (top column), and blue denotes under-expression (bottom column).
Prognostic analysis of the CDH family via Kaplan-Meier analyses
The impact of the entire CDH family on breast cancer survival was evaluated through the KM plotter database. Distant metastasis-free survival (DMFS) was analyzed due to its significance in clinical prognosis of advanced breast cancer. Results demonstrated that most CDH family genes were associated with the prognosis of BRCA patients including CDH1/2/3/4/5/7/9/10/11/12/13/15/16/19/26 (Figure 4 and Table 2). High expression levels of CDH1 (HR=1.32, 95% CI=1.13~1.55, p=0.0058), CDH2 (HR=1.39, 95% CI=1.17~1.64, p=0.00012), CDH3 (HR=1.55, 95% CI=1.32~1.82, p=6.4e-8), CDH4 (HR=1.27, 95% CI=1.08~1.5, p=0.0036), CDH7 (HR=1.34, 95% CI=1.14~1.58, p=0.00048), CDH9 (HR=1.21, 95% CI=1.03~1.43, p=0.02), CDH10 (HR=1.34, 95% CI=1.13~1.58, p=0.00059), CDH11 (HR=1.42, 95% CI=1.04~1.96, p=0.028), CDH12 (HR=1.21, 95% CI=1.03~1.41, p=0.019), CDH13 (HR=1.31, 95% CI=1.12~1.54, p=0.00089), CDH15 (HR=1.22, 95% CI=1.03~1.44, p=0.023), CDH16 (HR=1.28, 95% CI=1.09~1.5, p=0.003), and CDH26 (HR=1.68, 95% CI=1.28~2.19, p=0.00012) were correlated with poorer DMFS in BRCA patients. On the other hand, high expressions of CDH5 (HR=0.84, 95% CI=0.71~0.98, p=0.031) and CDH19 (HR=0.71, 95% CI =0.54~0.92, p=0.01) were associated with a good prognosis in BRCA patients. Other family members in the CDH family showed negative results.
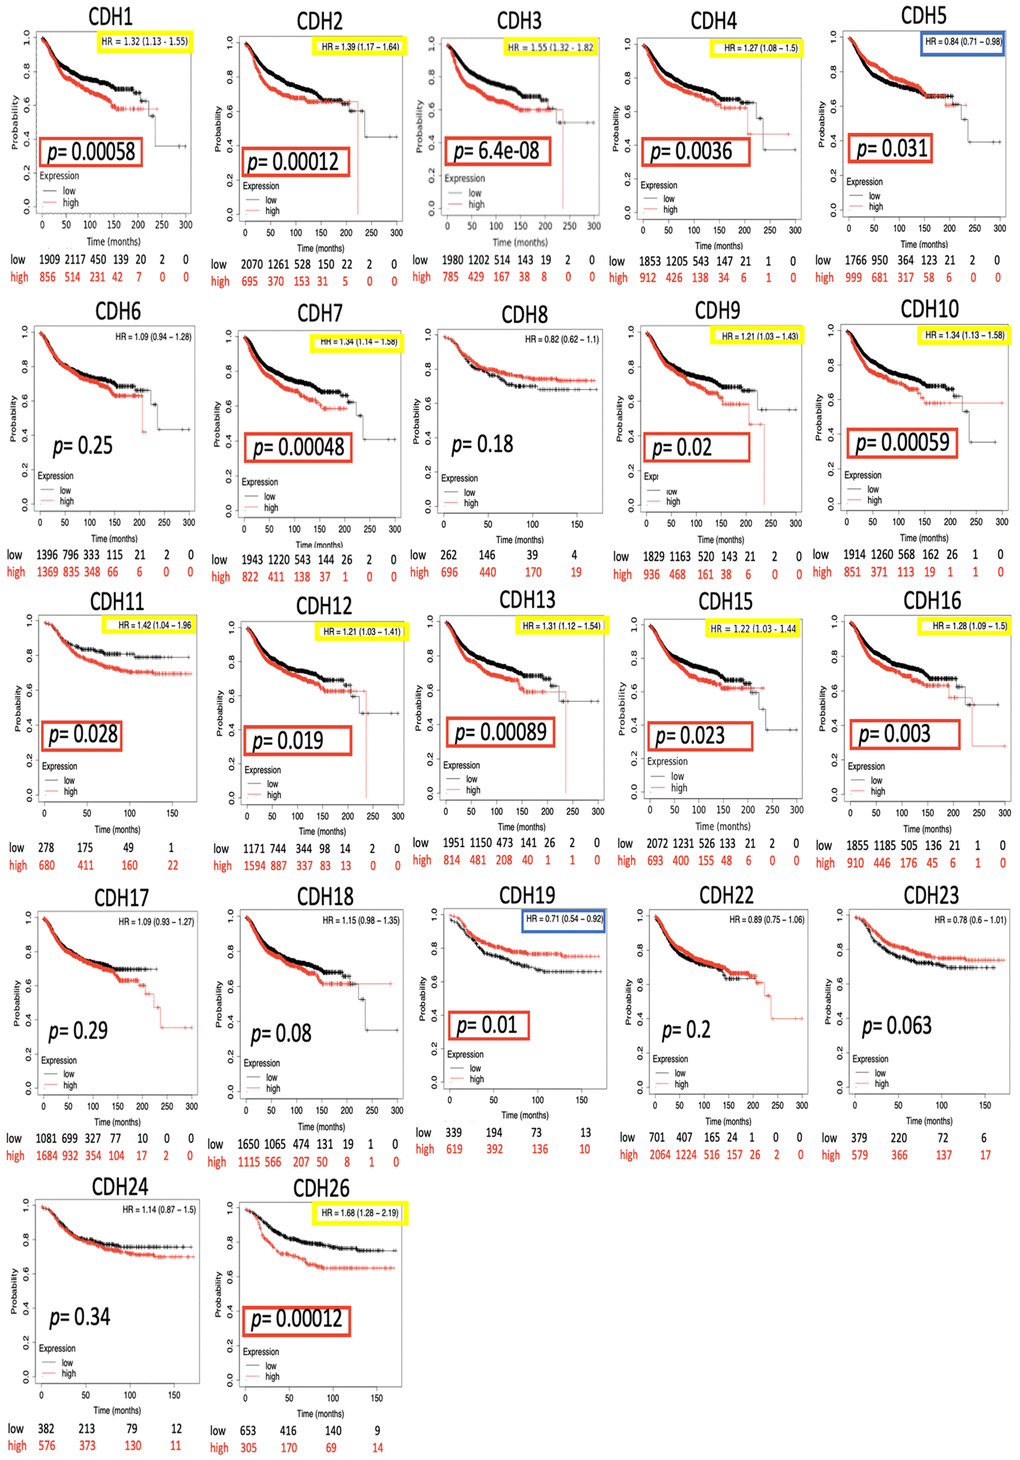
Figure 4. Kaplan-Meier (KM) analysis of cadherin (CDH) family genes in the distant metastasis-free survival (DMFS) of breast cancer patients. The hazard ratio (HR) represents a prognostic value of breast cancer patients. Log[rank p] was utilized to find out the level of prognostic significance of breast cancer patients. In addition, log[rank p] of <0.05 was considered a significant difference in the prognosis of breast cancer patients. High expressions of CDH1/2/3/4/5/7/9/10/11/12/13/15/16/19/26 were significant compared to low expressions, which are highlighted with p values in red boxes. The HRs of CDH1/2/3/4/7/9/10/11/12/13/15/16/26 were significantly higher, which are marked in yellow boxes, indicating poor prognostic outcomes in breast cancer. In contrast, the HRs of CDH5/19 were significantly lower, which were marked in blue boxes, indicating better prognostic outcomes in breast cancer.
Table 2. Kaplan-Meier analysis of CDH family genes in distant metastasis-free survival (DMFS) in breast cancer.
| Gene | HR (95% CI) | p value | Gene | HR (95% CI) | p value | ||||||||||||||||||||||||||||||||||||||||||||||||||||||||||||||||||||||||||||||||||||||||||||||
| CDH1 | 1.32 (1.13~1.55) | 0.0058 | CDH12 | 1.21 (1.03~1.41) | 0.019 | ||||||||||||||||||||||||||||||||||||||||||||||||||||||||||||||||||||||||||||||||||||||||||||||
| CDH2 | 1.39 (1.17~1.64) | 0.00012 | CDH13 | 1.31 (1.12~1.54) | 0.00089 | ||||||||||||||||||||||||||||||||||||||||||||||||||||||||||||||||||||||||||||||||||||||||||||||
| CDH3 | 1.55 (1.32~1.82) | 6.4e-08 | CDH15 | 1.22 (1.03~1.44) | 0.023 | ||||||||||||||||||||||||||||||||||||||||||||||||||||||||||||||||||||||||||||||||||||||||||||||
| CDH4 | 1.27 (1.08~1.5) | 0.0036 | CDH16 | 1.28 (1.09~1.5) | 0.003 | ||||||||||||||||||||||||||||||||||||||||||||||||||||||||||||||||||||||||||||||||||||||||||||||
| CDH5 | 0.84 (0.71~0.98) | 0.031 | CDH17 | 1.09 (0.93~1.27) | 0.29 | ||||||||||||||||||||||||||||||||||||||||||||||||||||||||||||||||||||||||||||||||||||||||||||||
| CDH6 | 1.09 (0.94~1.28) | 0.25 | CDH18 | 1.15 (0.98~1.35) | 0.08 | ||||||||||||||||||||||||||||||||||||||||||||||||||||||||||||||||||||||||||||||||||||||||||||||
| CDH7 | 1.34 (1.14~1.58) | 0.00048 | CDH19 | 0.71 (0.54~0.92) | 0.01 | ||||||||||||||||||||||||||||||||||||||||||||||||||||||||||||||||||||||||||||||||||||||||||||||
| CDH8 | 0.82 (0.62~1.1) | 0.18 | CDH22 | 0.89 (0.75~1.06) | 0.2 | ||||||||||||||||||||||||||||||||||||||||||||||||||||||||||||||||||||||||||||||||||||||||||||||
| CDH9 | 1.21 (1.03~1.43) | 0.02 | CDH23 | 0.78 (0.6~1.01) | 0.063 | ||||||||||||||||||||||||||||||||||||||||||||||||||||||||||||||||||||||||||||||||||||||||||||||
| CDH10 | 1.34 (1.13~1.58) | 0.00059 | CDH24 | 1.14 (0.87~1.5) | 0.34 | ||||||||||||||||||||||||||||||||||||||||||||||||||||||||||||||||||||||||||||||||||||||||||||||
| CDH11 | 1.42 (1.04~1.96) | 0.028 | CDH26 | 1.68 (1.28~2.19) | 0.00012 | ||||||||||||||||||||||||||||||||||||||||||||||||||||||||||||||||||||||||||||||||||||||||||||||
| High expressions of CDH1/2/3/4/5/7/9/10/11/12/13/15/16/19/26 were significant compared to low expressions. | |||||||||||||||||||||||||||||||||||||||||||||||||||||||||||||||||||||||||||||||||||||||||||||||||||
A univariate Cox regression analysis was conducted to validate our results from clinical breast cancer patients, data of which were obtained from the TIMER database. The univariate Cox regression demonstrated that high levels of CDH13 were an independent risk factor for poor overall survival (OS) (Supplementary Table 1A) in breast cancer patients. In addition, subtypes of breast cancer, including luminal, HER2, and basal, were analyzed. The luminal subtype showed no significance among CDHs (Supplementary Table 1B). CDH12 was a significant risk factor for poor OS in the HER2 subtype (Supplementary Table 1C). CDH11 and CDH12 were significant risk factors for poor OS in the basal subtype (Supplementary Table 1D).
To further understand correlations of expression levels of CDH family members in breast cancer, some clinical and pathological factors were analyzed in specific genes among the CDH family. Among all CDH family members, CDH1/2/3/4/7/9/10/11/12/13/15/16/26 were significantly positively associated with a lower DMFS (Figure 4), and CDH1/2/4/6/7/11/12/13/15/22/23/24 mRNA expression levels were higher in breast cancer than in normal tissues in the Oncomine database (Figure 2A, 2B). Results demonstrated that the eight CDH1/2/4/7/11/12/13/15 genes simultaneously expressed significance in the gene database and clinical survival analysis. Therefore, in this study, these eight specific genes were further analyzed with an extensive database, clinical factors, and bioinformatics tools and were demonstrated to be potential biomarkers for breast cancer.
Correlations of CDH1, CDH2, CDH4, CDH7, CDH11, CDH12, CDH13, and CDH15 expressions with prognosis and different clinical and pathological factors
As CDH1/2/4/7/11/12/13/15 were positive in terms of both gene expressions and with the KM survival analysis, immunohistochemical (IHC) patterns from the HPA were utilized to validate clinical applications by pathology (Figure 5A, 5B). CDH1, CDH2, and CDH12 exhibited strong intensities in cell nuclei in breast cancer samples. Otherwise, other members of the CDH family showed negative or weak intensities in pathological samples. The relative staining intensities of CDH1 were negative (two cases), moderate (one case), and strong (eight cases) in breast cancer samples. CDH2 staining intensities were negative (nine cases), weak (three cases), and strong (one case) in breast cancer samples. CDH12 staining intensities were negative (one case), weak (three cases), moderate (one case), and strong (seven cases) in breast cancer samples. There was no IHC pattern for CDH4 obtained from the HPA. Other staining intensities of CDH family members are shown in Figure 5A, 5B. CDH staining expressions, magnification in 4x, were displayed among CDH family except CDH13 and CDH15 due to negative intensities.
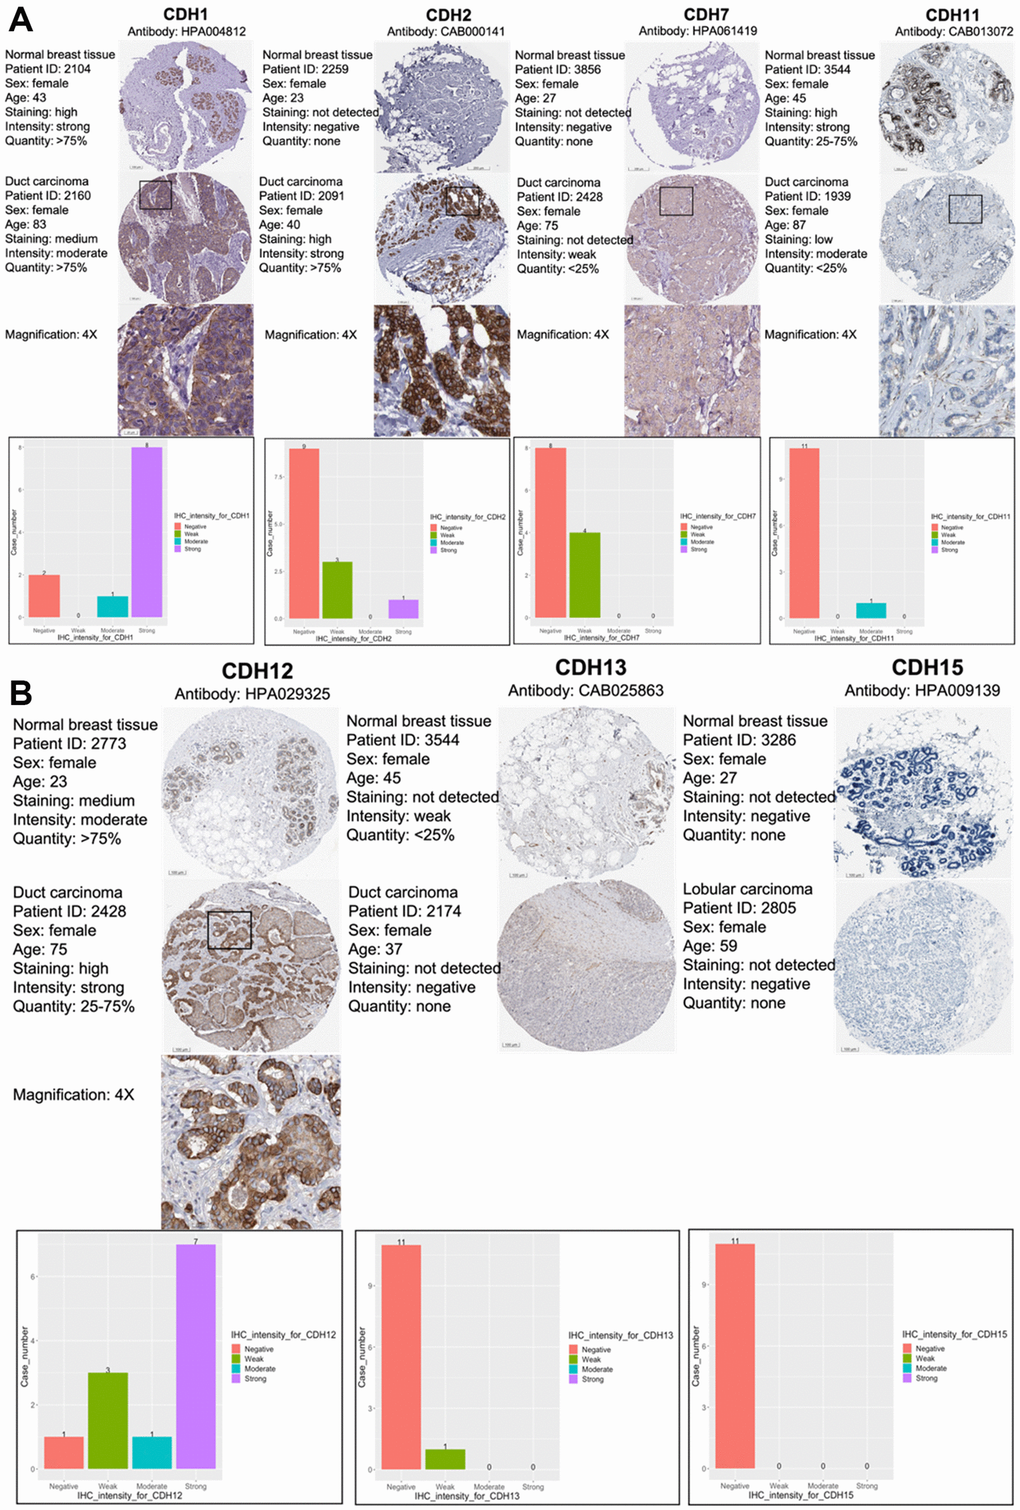
Figure 5. Protein expression levels of members of cadherin (CDH) family genes in all clinical breast cancer specimens from the Human Protein Atlas (HPA). (A) Images of immunohistochemistry (IHC) of CDH1/2/7/11 show their staining intensities. IHC images and patients’ information were obtained from the HPA. Normal and tumor samples are listed, and bar charts represent the quantification of IHC staining in breast cancer samples. There were strong intensities of CDH1 and CDH2 in breast cancer samples. (B) IHC images of CDH12/13/15 show their staining intensities. IHC images and patient information were obtained from the HPA. Normal and tumor samples are listed, and bar charts present quantification of IHC staining in breast cancer samples. There were strong intensities of CDH12 in breast cancer samples.
Correlations of expression levels of CDH1/2/4/7/11/12/13/15 with pathological stages of breast cancer are shown in violin plots in Figure 6A. mRNA levels of CDH1/11/13 were relatively high in breast cancer patients classified as stage IV with metastasis but without statistical significance.
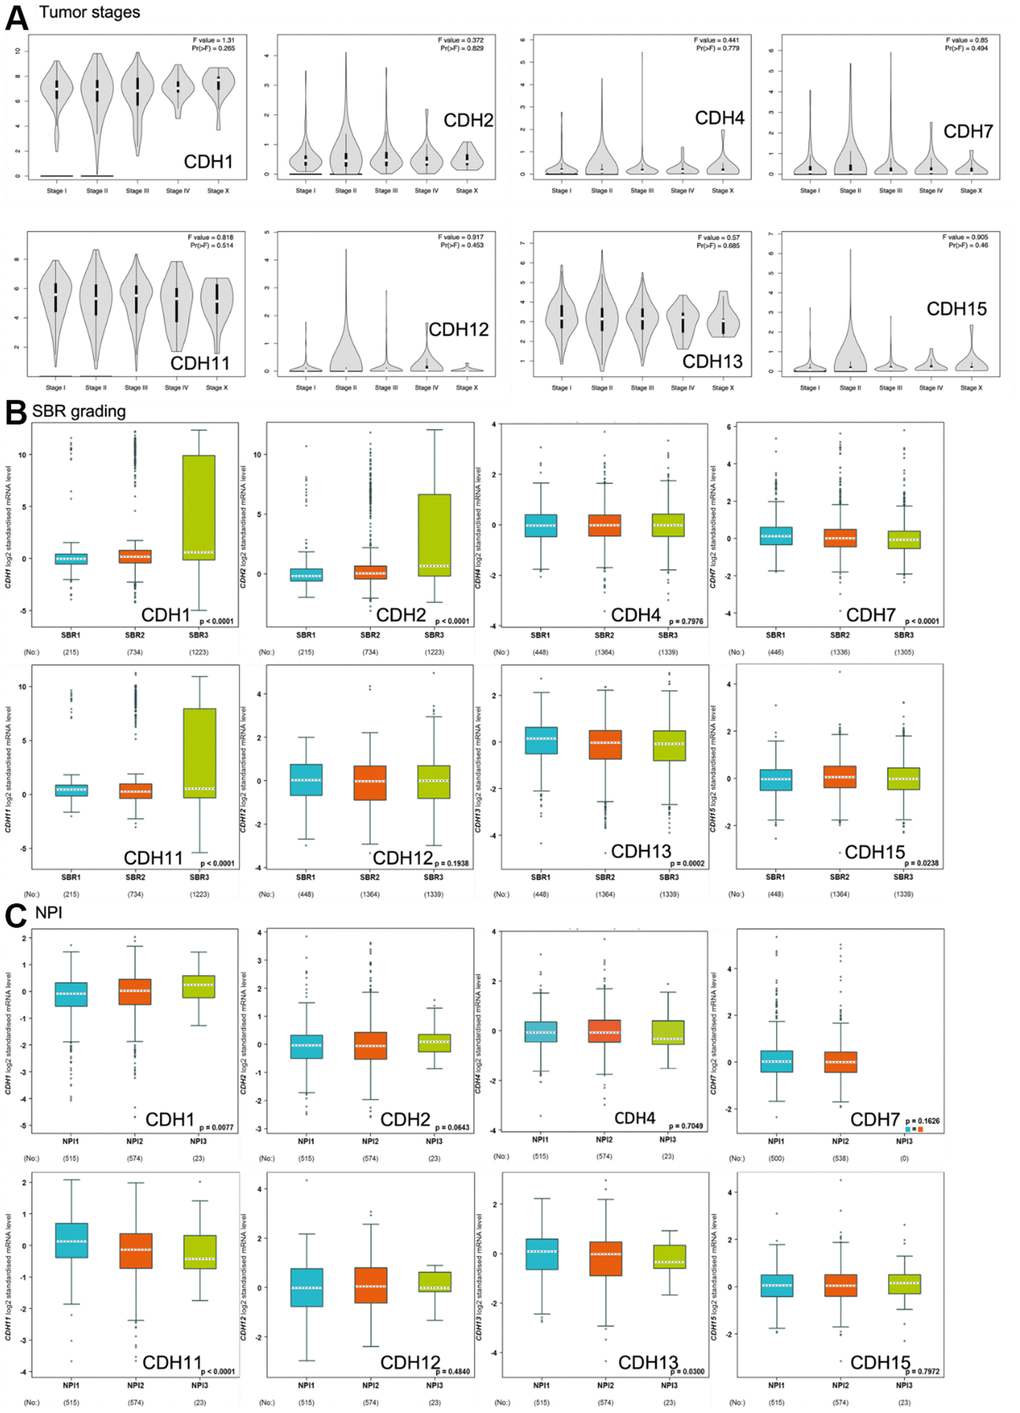
Figure 6. Expression of cadherin (CDH) family genes in subgroups of breast cancer patients. (A) Gene expression analysis among the stages of CDH genes in a breast cancer (GEPIA2) database. The violin plot displayed comparisons of CDH genes expressions from TCGA dataset of breast cancer. An independent t-test was utilized for p values; p<0.05 meant statistically significant; Pr(>F) <0.05 was based on Student’s t-test. (B) Scarff-Bloom-Richardson (SBR) grading of CDH family genes. Associations between CDH1/2/4/7/11/12/13/15 and SBR grading were analyzed via the bc-GenExMiner dataset. (C) The Nottingham prognostic index (NPI) of CDH family genes. Associations between CDH1/2/4/7/11/12/13/15 and NPI values were analyzed via the bc-GenExMiner dataset.
Scarff-Bloom-Richardson (SBR) grading is a clinical prognostic predictor associated with cell proliferation and an indicator of the response to chemotherapy (Figure 6B). A determination of an association between the SBR grade and responsiveness would be clinically useful [82]. SBR1 indicates good differentiation, SBR2 moderate differentiation, and SBR3 poor differentiation. Figure 6B demonstrates that CDH1, CDH2, and CDH11 with the poorest prognoses were assigned to grade SBR3.
The Nottingham prognostic index (NPI) is used to predict a prognosis after breast cancer surgery, and is calculated by three pathological factors: the tumor size, the number of involved lymph nodes, and the tumor grade (Figure 6C). Values are used to define three subsets of patients with different survival chances of breast cancer: 1) good prognosis, comprising 29% of patients with an 80% chance of 15-year survival; 2) moderate prognosis, 54% of patients with a 42% chance of 15-year survival; and 3) poor prognosis, 17% of patients with a 13% chance of 15-year survival [83]. The NPI can also be used to evaluate the effect of adjuvant treatment like chemotherapy or radiotherapy. Figure 6C demonstrates that only CDH1 expression was correlated with higher NPI values, indicating poor prognoses in patients with CDH1 gene expression. Otherwise, CDH11 and CDH13 expressions demonstrated lower NPI values with better prognoses. Other CDH family members showed no significance.
Other clinical predictors were also analyzed in terms of CDH family gene expressions in breast cancer (Supplementary Figure 2 in Supplementary Materials). Estrogen receptor (ER)/progesterone receptor (PR)-positive samples showed a high probability of positive effects of hormone therapy such as with tamoxifen. HER2 samples corresponded to positive effects of targeted therapy with trastuzumab. Subtypes of breast cancer including basal-like, HER2-E, luminal A, and luminal B were correlated with different pathological characteristics and clinical prognoses. Mutations of breast cancer gene-1 (BRCA1) and BRCA2 were also analyzed with respect to CDH family gene expressions, which represent breast cancer oncogenes (Supplementary Figure 2D). Supplementary Figure 2A demonstrates that ER-/PR- expressions were correlated with higher expressions of CDH2 and CDH11, indicating a poorer response to hormone therapy. Supplementary Figure 2B demonstrates that HER2-negative expression was found to be associated with CDH7 and CDH11, suggesting a poorer response to targeted therapy. Supplementary Figure 2C demonstrates relationships of different subtypes of breast invasive carcinoma with CDH family gene expressions. CDH1 was highly expressed by the HER2-E and luminal B types; CDH2 was highly expressed by the HER2-E type; CDH4 was highly expressed by the basal-like type; CDH7 and CDH11 were highly expressed by the luminal A type; CDH12 and CDH13 were highly expressed by the basal-like and luminal A types; and CDH15 expression was significantly associated with no types.
Gene mutation analysis of CDH1/2/4/7/11/12/13/15 in breast cancer
Genomic changes in the CDH family were analyzed via the cBioPortal database, which demonstrated changes in CDH1 (14%), CDH2 (6%), CDH4 (11%), CDH7 (5%), CDH11 (5%), CDH12 (7%), CDH13 (4%), and CDH15 (4%) (Figure 7A). Our results of mutated gene frequencies demonstrated that those of CDH1 and CDH4 were >10%. Altered genes at higher frequencies affect signaling pathways and cellular processes and can induce tumorigenesis based on previous studies [84–86]. CDH1 showed more gene alterations of truncating mutations and deep deletions, and low mRNA expression, while in contrast, CDH4 showed more amplifications and high mRNA expression. In the METABRIC dataset, CDH1 acted more like a TSG, and CDH4 acted like an oncogene in breast cancer. A previous study demonstrated that loss of E-cadherin was a key hallmark of ILCs [87]. In Giovanni et al. [86], CDH1 was one of the most recurrently mutated genes in breast cancer. In mixed ILC-IDC samples, genetic alterations of ILC tumors were found at a frequency of 14%. Mutations targeting CDH1 were mostly truncated mutations, and this result was similar to our mutation analysis.
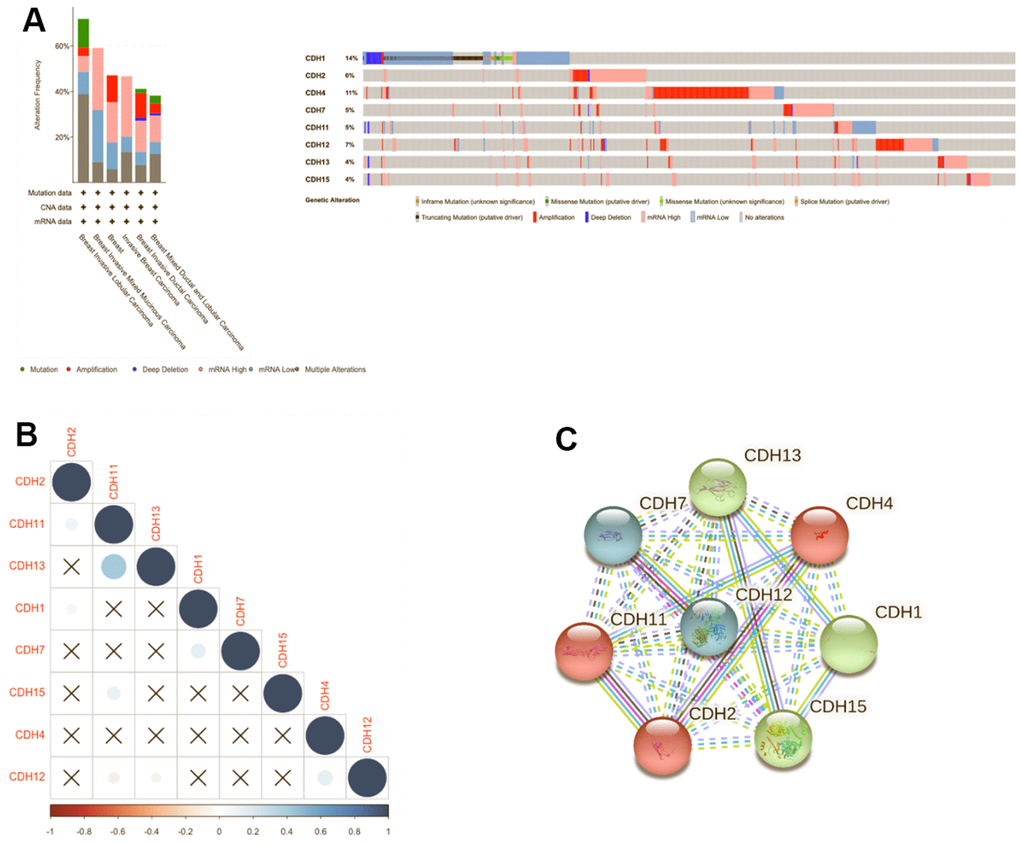
Figure 7. Genomic alterations of differentially expressed cadherin 1 (CDH1)/2/4/7/11/12/13/15 genes in breast cancer. (A) The cBioPortal database was used to reveal levels of gene amplification, deep deletions, and associated nucleotide substitutions of the CDH1/2/4/7/11/12/13/15 genes in breast cancer progression in the METABRIC dataset. (B) Correlation plot of the CDH1/2/4/7/11/12/13/15 genes in breast cancer (cBioPortal) database. Insignificant correlation values were displayed by crosses; p<0.01 was considered statistically significant. (C) Protein-protein interactions (PPIs) of CDH1/2/4/7/11/12/13/15 (STRING database). Highly interacting proteins were represented as hub protein nodes in the PPI network.
We also used Pearson’s correlations to calculate correlations between CDH family members based on mRNA expressions (Figure 7B). CDH11 was significantly positively correlated with CDH13. Other genes in the CDH family otherwise showed no relative correlations with each other (Figure 7B). In addition, a protein-protein interacting (PPI) network analysis of the CDH family was conducted via STRING at various transcription levels to investigate potential relationships. The STRING analysis revealed that linkages among CDH gene family members were complicated. Using a three-group k-means algorithm, it was found that the group consisting of CDH1, CDH13, and CDH15 had a close relationship, and CDH2, CDH4, and CDH11 comprised another related group. A third group consisted of CDH7 and CDH12 (Figure 7C).
DNA methylation analysis of CDH1/2/4/11/12/13 in breast cancer
We present a heatmap of DNA methylated locations of CDH1/2/4/11/12/13 in breast cancer in Supplementary Figure 3 in “Supplementary Materials”. In total, 18 methylated CpG sites were determined for CDH1, with six CpG sites presenting high expressions. Among them, cg26508465 and cg09220040 showed the highest levels of DNA methylation. In total, 20 methylated CpG sites of CDH2 were determined with six CpG sites presenting high expressions. Among them, cg24776465 showed the highest level of DNA methylation. In total, there were 26 methylated CpG sites of CDH11, with 19 CpG sites presenting high expressions. Among them, cg02724025 showed the highest level of DNA methylation. Over half of the CpG sites of CDH11 presented high levels of methylation and relevance to breast cancer. These results provide a potential mechanism by which CDH11 can serve as an oncogene for breast cancer.
Regulated networks of CDH1/2/4/7/11/12/13/15 in breast cancer
To understand how DEG lists are linked to downstream CDH-regulated networks in various biological pathways and diseases, an enrichment analysis was performed using MetaCore software. After uploading genes coexpressed with CDH1 from Metabric and TCGA databases into MetaCore, we found that numerous pathways and networks were related to cell cycle (Figure 8 and Supplementary Table 2 in Supplementary Materials) including “Immune response_B cell antigen receptor (BCR) pathway”, “Oxidative stress ROS-induced cellular signaling”, “Development_negative regulation of WNT/Beta-catenin signaling in the cytoplasm”, and “Immune response_IFN-alpha/beta signaling via PI3K and NF-κB pathways”.
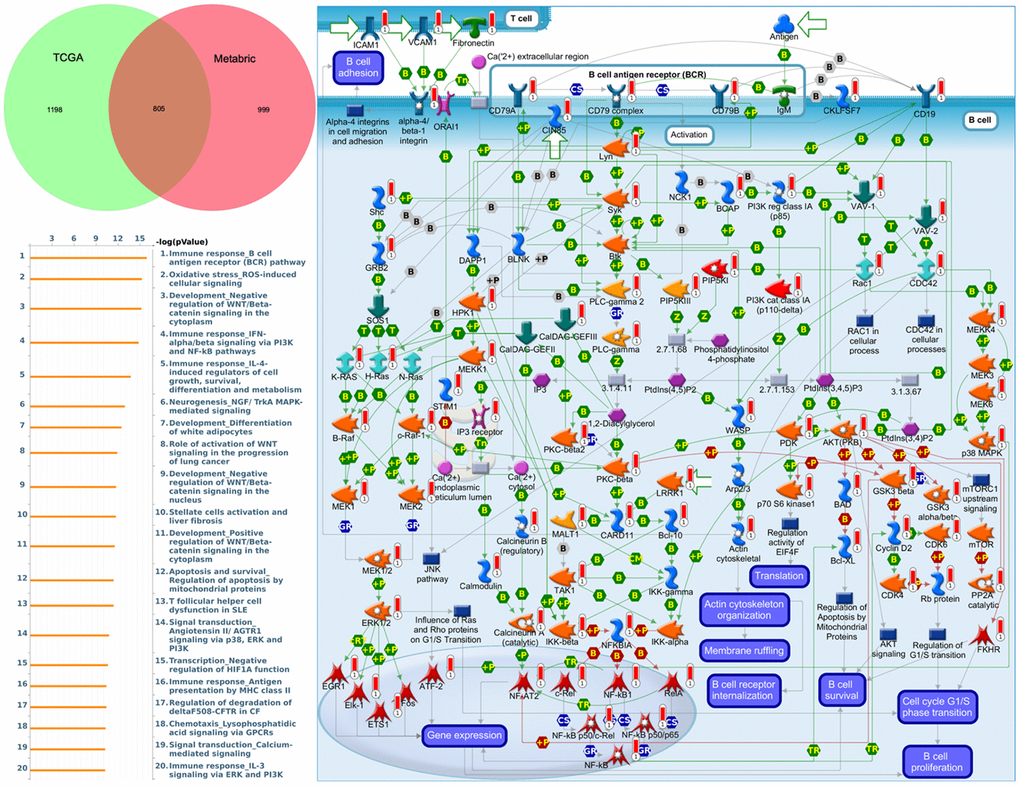
Figure 8. MetaCore enrichment pathway analysis of genes coexpressed with cadherin 1 (CDH1). The top 10% of expressed genes coexpressed with CDH1 from both Metabric (1804 genes) and TCGA (2003 genes) were extracted. Overlapping (805) genes were integrated to implement a pathway analysis, which formed a pathway list ordered by the -log p value. “Immune response B cell antigen receptor (BCR) pathway” was at the top of the pathway list when performing the “biological process” analysis. The figure demonstrates interactions between genes and proteins. Symbols represent proteins. Arrows depict protein interactions (green, activation; red, inhibition). Thermometer-like histograms indicate microarray gene expressions (blue, downregulated; red, upregulated).
Similar pathway analyses of CDH2, CDH4, CDH7, CDH11, CDH12, CDH13, and CDH15 are displayed in “Supplementary Materials” (Supplementary Figures 4–9 and Supplementary Tables 3–9). Genes coexpressed with CDH2 were correlated with “Cell adhesion_ECM remodeling” and “Cytoskeleton remodeling_Regulation of actin cytoskeleton organization by the kinase effectors of Rho GTPases” (Supplementary Figure 4). Genes coexpressed with CDH4 were correlated with “Protein folding and maturation POMC processing”, “Beta-catenin-dependent transcription regulation in colorectal cancer”, and “Cell adhesion_ECM remodeling” (Supplementary Figure 5). Genes coexpressed with CDH7 were correlated with “Cell cycle_Chromosome condensation in prometaphase” and “Cell cycle_the metaphase checkpoint” (Supplementary Figure 6). Genes coexpressed with CDH11 were correlated with “Cell adhesion_ECM remodeling”, “IL-1 beta-and endothelin-1-included fibroblast/myofibroblast migration and extracellular matrix production in asthmatic airways”, and “Development regulation of epithelial to mesenchymal transition (EMT)” (Supplementary Figure 7). Genes coexpressed with CDH12 were correlated with “Cytoskeleton remodeling_Regulation of actin cytoskeleton organization by the kinase effectors of Rho GTPases” and “Development negative regulation of WNT/Beta catenin signaling in the cytoplasm”. Genes coexpressed with CDH13 were correlated with “Development_Regulation of epithelial-to-mesenchymal transition (EMT)”, “Role of stellate cells in progression of pancreatic cancer”, and “Cell adhesion ECM remodeling” (Supplementary Figure 8). Genes coexpressed with CDH15 were correlated with “Transcription_HIF-1 targets”, “Oxidative stress_ROS-induced cellular signaling”, and “Development_negative regulation of WNT/Beta catenin signaling in the cytoplasm”. In summary, genes coexpressed with CDH11 and CDH13 were both correlated with regulation of the EMT, while genes coexpressed with CDH2, CDH4, CDH11, and CDH13 were all correlated with cell adhesion.
Comprehensive results of CDH1/2/4/11/12/13 in the functional enrichment analysis
Gene ontology (GO) enrichment analysis
For comprehensive analysis, we obtained data from the METABRIC and TCGA datasets to acquire GO enrichment results including BPs, CCs, MFs, and KEGG (Supplementary Figures 9A–14A in Supplementary Materials). The BP analysis demonstrated that CDH1 was correlated with T-cell activation; the CC analysis showed correlations with cell-cell junctions and vacuolar membranes; MFs revealed significant relationships with phospholipid binding and actin binding, while KEGG ontology indicated the role of the mitogen-activated protein kinase (MAPK) signaling pathway and cytokine-cytokine receptor interactions (Supplementary Figure 9A). For CDH2, BPs demonstrated correlations with positive regulation of catabolic processes; the CC analysis showed correlations with mitochondrial matrix and cell-cell junctions; MFs revealed significant relationships with actin binding and protein serine/threonine kinase activity, while KEGG ontology indicated the role of the phosphatidylinositol 3-kinase (PI3K)-Akt signaling pathway (Supplementary Figure 10A). For CDH4, BPs demonstrated correlations with proteasomal protein catabolic process; the CC analysis showed correlations with the mitochondrial inner membrane and mitochondrial matrix; MFs revealed significant relationships with actin binding and ion channel activity, while KEGG ontology indicated the role of pathways of multiple neurodegenerative diseases (Supplementary Figure 11A). For CDH11, BPs demonstrated correlations with non-coding (nc)RNA metabolic processes; the CC analysis showed correlations with the mitochondrial inner membrane and mitochondrial matrix; MFs revealed significant relationships with transcription coregulator activity and actin binding, while KEGG ontology indicated the role of pathways of multiple neurodegenerative diseases (Supplementary Figure 12A). For CDH12, BPs demonstrated correlations with positive regulation of catabolic processes; the CC analysis showed correlations with cell-cell junctions and the mitochondrial matrix; MFs revealed significant relationships with phospholipid binding and actin binding, while KEGG ontology indicated the role of pathways of multiple neurodegenerative diseases (Supplementary Figure 13A). For CDH13, BPs demonstrated correlations with positive regulation of catabolic processes; the CC analysis showed correlations with cell-cell junctions and the mitochondrial matrix; MFs revealed significant relationships with transcription coregulator activity, while KEGG ontology indicated the role of neuroactive ligand-receptor interactions (Supplementary Figure 14A).
Micro-(mi)RNA-regulated network analysis of CDH1/2/4/11/12/13
We used the miRWalk database to identify associations with CDH1/2/4/11/12/13, and network regulation was analyzed by an IPA. Analysis of miRNA-regulated networks with CDHs (Supplementary Figure 15) indicated that hsa-miR-219a-2-3p regulated CDH1 and was thus associated with breast cancer development; hsa-miR-330-3p, has-miR-4429, and hsa-miR-199a-5p regulated CDH2; hsa-miR-4644, hsa-miR-211-5p, hsa-miR-520f-3p, hsa-miR-34e-5p, and hsa-miR-34a-5p regulated CDH4; hsa-miR-486-5p, hsa-miR-200c-3p, hsa-miR-200b-3p, hsa-miR-26a-5p, hsa-miR-140-5p, hsa-miR-128-3p, and hsa-miR-19a-3p regulated CDH11; and hsa-miR-30c-5p regulated CDH13. In a previous study, the miRNA hsa-miR-200 family was identified as being a definitive factor of the epithelial phenotype of malignant cells, which targeted the E-cadherin repressors, zinc finger E-box-binding homeobox 1 (ZEB1) and ZEB2 [88–90]. Meanwhile, hsa-miR-200 was identified as a repressor of the EMT and was downregulated in more-aggressive molecular subtypes of breast tumors such as HER2 and triple-negative [91]. Our results of miRNA-regulated networks that hsa-miR-200c-3p and hsa-miR-200b-3p regulated CDH11 were consistent with previous studies.
Levels of immune infiltration in breast cancer were related to CDH1/2/4/7/11/12/13/15 Expressions
The TIMER database was utilized to investigate the immunological microenvironment. We identified correlations of immune infiltration levels with expressions of CDH gene family members in breast cancer (Figure 9). Results of the analysis showed significant correlations of CDH1 with cluster of differentiation 4-positive (CD4+) T cells; CDH2 with CD4+ T cells, macrophages, neutrophils, and dendritic cells (DCs); CDH4 with CD8+ T cells, CD4+ T cells, macrophages, neutrophils, and DCs; CDH7 with CD8+ T cells; CDH11 with CD8+ T cells, CD4+ T cells, macrophages, neutrophils, and DCs; CDH12 with B cells and DCs; CDH13 with CD8+ T cells, CD4+ T cells, macrophages, neutrophils, and DCs; and CDH15 with CD8+ T cells.
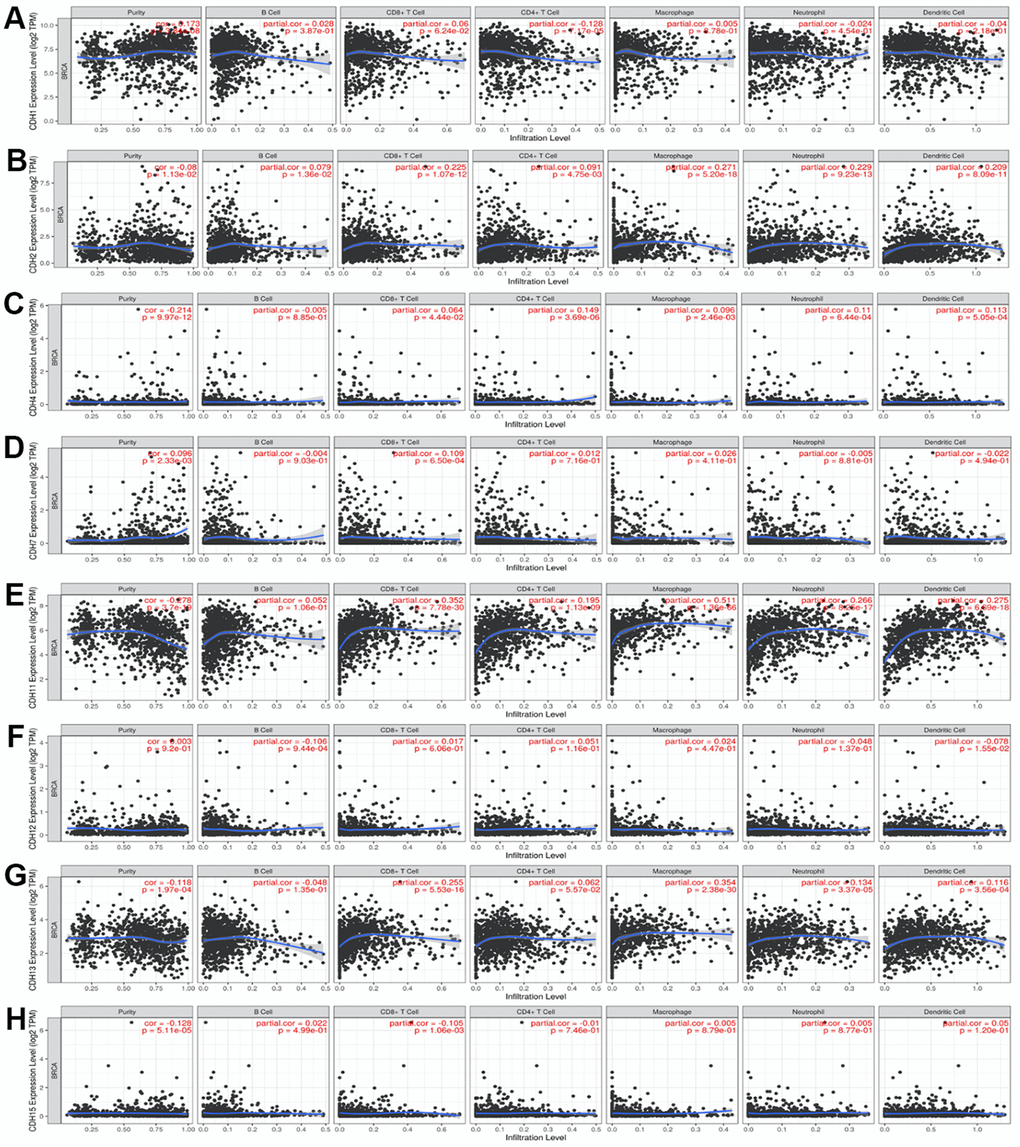
Figure 9. (A–H) Correlations between differentially expressed cadherin 1 (CDH1)/2/4/7/11/12/13/15 genes and immune cell infiltration in breast cancer. The figure showed that CDH1 (A); CDH2 (B); CDH4 (C); CDH7 (D); CDH11 (E); CDH12 (F); CDH13 (G); CDH15 (H) gene expressions were associated with tumor purity and tumor-infiltrating immune cell markers, such as cluster of differentiation 8-positive (CD8+) T cells, B cells, CD4+ T cells, neutrophils, macrophages, and dendritic cells. Spearman correlations were applied to describe correlations between the CDH1/2/4/7/11/12/13/15 genes and the abovementioned immune cells (p<0.05 was accepted as statistically significant).
Drug target network analysis of CDH1/2/4/11/12/13
After comprehensive research on CDH family members, we were curious about drug targets and related mechanisms of drug resistance. Hence, drug target networks of CDH1/2/4/11/12/13 were analyzed by the MetaCore and MetaDrug system (Supplementary Figure 16 in Supplementary Materials). We found that “Signal transduction_c-myc, CREB1 signaling” was the top drug target of CDH1; “Cell adhesion_Fibrinogen, collagen signaling” was the top drug target of CDH2; “Metabolism_PPAR, RXR, VDR regulation of metabolism” was the top drug target of CDH4; “Cell adhesion_Fibrinogen, collagen signaling” was the top drug target of CDH11; “Transport_Potassium transport (core work 1)” was the top drug target of CDH12; and “Cell adhesion_Intergrin signaling” was the top drug target of CDH13.
Discussion
In previous studies, the CDH family was proven to be associated with invasiveness and metastasis [92–95]. The cadherin family as transmembrane glycoproteins mediate calcium-dependent cell-cell adhesion and regulates cell growth and differentiation. In the process of cell adhesion, cadherins act as essential factors to maintain stable homeostasis of tissue structures [96–98]. Once cell-cell adhesion is disturbed, adhesion-related pathways are subsequently interfered with. Disruption of cadherin signaling has determining influence on tumor progression and tumor immune responses [99–104].
In the present study, to determine whether CDH family members can serve as suitable biomarkers for breast cancer and pathways related to the EMT and metastasis, comprehensive integrative data mining was utilized, including gene expressions, survival analyses, clinical and pathological factors, immune infiltration, and enrichment pathway analyses. In the Oncomine, TIMER, and prognostic analyses, significantly high expression levels of CDH1/2/4/7/11/12/13/15 were observed in breast cancer compared to normal tissue samples, and these were associated with poor DMFS outcomes. These results were confirmed by IHC staining in which CDH1, CDH2, and CDH12 exhibited strong intensities. Furthermore, results of the bc-GenExMiner database demonstrated that increased CDH4/12/13 expressions were associated with basal-like breast cancer, and increased CDH1/2/11 expressions suggested a high SBR grade status in patients. Genetic mutations of CDH1 and CDH4 at frequencies of >10% showed higher possibilities of altering cell signaling pathways and promoting proliferation in malignancies. CDH2, CDH4, and CDH11 had close relationships via the PPI network, and this was further confirmed by the MetaCore enrichment pathway analysis. These three CDH family genes, CDH2, CDH4 and CDH11, and genes coexpressed with CDH13 were correlated with the “Cell adhesion_ECM remodeling” process. CDH11 and CDH13 were also found to be closely related to CDH1 due to its roles in regulating of the EMT. The enrichment pathway results suggested that in addition to CDH1, genes coexpressed with CDH11 and CDH13 were also correlated with “Development_Regulation of the epithelial-to-mesenchymal transition (EMT)”. These correlations of CDH family genes could lead to a better understanding of breast cancer development and metastasis.
The ability to infiltrate different tissues is a critical step in cancer because it defines the metastatic potential of tumor cells [105–108]. This capacity can be achieved by the EMT [109–111]. Previous studies reported that the EMT is featured by the loss of CDH1 expression and the concomitant upregulation or de novo expression of CDH2, the so-called “cadherin switch”, which is associated with increased migration and invasiveness and thus poor prognoses [112–115]. The EMT causes disorganization of cell-cell adhesive junctions, thereby facilitating cancer metastasis. Irrespective of CDH1 expression, the migratory and invasive capacities are present in tumor cells by CDH2 expression. Therefore, CDH2 seems to be the key factor in epithelial cancer metastasis and disease progression. Those studies demonstrated the key roles of CDH2 in cancer metastasis, corresponding to our results with poor survival prognoses, strong intensities in pathological samples, and advanced SBR grading, indicating poor cell differentiation. Furthermore, we found that CDH2/4/11 had similar signaling pathways with cell adhesion, which was further correlated with the EMT. In other words, high expression levels of CDH2/4/11 are crucial for the EMT and cancer metastasis. To validate our results of positive correlations between CDH genes and the EMT, Pearson’s correlations were utilized to calculate correlations between CDH1/2/4/7/11/12/13/15 and EMT-regulated genes such as TWIST and SNAIL based on mRNA expression levels (Supplementary Figure 17 in Supplementary Materials). Other EMT-core genes associated with cell adhesion and migration were obtained from a previous study [116]. CDH11 displayed the greatest correlations with COL3A1, COL1A1, COL5A1, and ADAM12 with Spearman’s rank correlation coefficients of >0.5 among these eight genes. CDH13 showed mild positive correlations with COL3A1, COL1A1, COL5A1, ADAM12, SNAI2, COL6A1, and TWIST2. Conversely, traditional EMT markers, CDH1 and CDH2, demonstrated nearly no correlations with these common EMT-regulated genes. CDH1 only showed mild negative correlations with TWIST2 and SNAI3. Other genes otherwise showed relatively no correlations with EMT-core genes. It was interesting to discover that CDH11/13 demonstrated greater correlations with EMT-core genes rather than the traditional EMT-related cadherins, E-cadherin and N-cadherin, as mentioned in previous research [117, 118]. Our results supported the roles of CDH11 in inducing the EMT, which corresponded to other research not only in cancer [119] but in other diseases including melasma [120] and pulmonary fibrosis [121].
To understand drug targets of CDH family genes, we implemented a drug target network analysis (Supplementary Figure 16). Since drug target network analyses of the CDH2, CDH11, and CDH13 genes were all targeted to cell adhesion, we thus discussed the roles of cell adhesion in drug resistance. Cancer cells attaching to microenvironment components such as collagen type 1 (COL1) weakens the sensitivity of chemotherapeutic drugs like mitoxantrone, which is called cell adhesion-mediated drug resistance (CAM-DR) [122]. In consideration of the extensive presence of COL1 in mammary glands, breast cancer appears to have a high probability of presenting CAM-DR. The importance of COL1 is proven that patients with high-density breast tissues have higher risks of breast cancer [123–125] and poorer outcomes due to metastatic processes [126]. Regarding CAM-DR, the EMT plays a crucial part in drug resistance to breast cancer as well. The epithelial cell adhesion molecule (EpCAM) was implicated in tumor progression and drug resistance in breast cancer [127]. It was proven that EpCAM-knockdown resulted in upregulation of CDH1 and attenuation of CDH2 expression, which reversed the EMT. This process demonstrated that the EpCAM might possess the capability to induce the EMT in breast cancer to promote multidrug resistance. In addition, transcriptional silencing of CDH1 was associated with the EMT in human breast cancer cells [128]. Previous research demonstrated that upregulation of E-cadherin by miR-200b and miR-200c via direct targeting the transcriptional repressors of E-cadherin, ZEB1 and ZEB2, inhibited the EMT [129]. In summary, CDH1/2/11/13 were associated with the cell adhesion network on drug targets and were thus associated with important factors in drug resistance.
CDH4 hypermethylation was significantly associated with increased risks for breast cancer in peripheral blood leukocyte DNA [130]. CDH11 was also known as one of the mediators that interacted with malignant cells and normal cells and was detected in various cancers, especially in metastatic cancer cell lines [131–133]. In particular, CDH11 was involved in the maintenance of high endogenous Rac activity and cytoskeletal reorganization in migratory breast cancer cells [134]. Moreover, because of the role of CDH11 as an inducer of metastatic signaling, targeting CDH11 triggered re-expression of the miR-335 tumor suppressor, which limited the CDH11-induced EMT. This phenomenon repressed cancer stem cell activities. CDH11-related pathways demonstrated the miR-335-mediated therapeutic value of anti-CDH11 antibody treatment and provided a therapeutic option in patients with metastatic breast cancer. Downregulation of CDH12 could inhibit the process of angiogenesis. Previous research implied that CDH12 might be influential in colorectal tumor metastasis [135]. CDH13 expression exhibited functions in cell adhesion and migration which were promoted by DNA polymerase beta (Pol β) by augmenting DNA demethylation of the CDH13 promoter [136]. Abnormal methylation of CDH13 promoter was observed in breast, colorectal, cervical and lung cancers, and chronic myeloid leukemia [137–139]. Those studies supported our results of the importance of CDH4/11/12/13 in tumorigenesis. We supposed that high mRNA expression levels of CDH4/11/12/13 were associated with breast cancer and poor survival.
As the tumor microenvironment plays important roles in tumorigenesis, we conducted an immune infiltration analysis in Figure 9. Previous studies also supported the associations between cadherin and immune pathways [140–142]. One of the most important pathways related to cadherin in immune responses is the Wnt pathway, which regulates cellular signaling by a canonical pathway with β-catenin [143]. β-Catenin plays a fundamental role in the cadherin protein complex, whose stabilization is crucial to activate the Wnt/β-catenin pathway. The WNT/β-catenin pathway mediates the self-renewal and relocation of cancer stem cells, promoting malignant progression and metastasis in breast cancer [144]. Our results of the enrichment pathway analysis were consistent with the importance of Wnt/β-catenin in breast cancer. Genes co-expressed with CDH1/12/15 were correlated with the pathway of “Development negative regulation of WNT/Beta catenin signaling in the cytoplasm”. Induction of Wnt/β-catenin signaling was crucial in maintenance of stemness of memory CD8+ T cells by blocking T-cell differentiation [145]. Clinical responses to immune checkpoint inhibitors were correlated with tumors in the immune cell microenvironment [146, 147]. The Wnt/β-catenin pathway is considered to be a potential target for cancer treatment. In pancreatic cancer, effective immunotherapy is likely to require upregulation of CDH1 expression [148]. The roles of cadherin and Wnt/β-catenin signaling in regulating immune cell infiltrations of the tumor microenvironment aroused interest in immunotherapy treatment.
This study performed a comprehensive and systematic review of the genetic expressions, prognostic values, mutation levels, immune infiltration, and enrichment pathways of the CDH family. CDH1/2/4/11/12/13 expressions are significantly increased in breast cancer and are associated with poor clinical prognoses of DMFS. We concluded that CDH1/2/4/11/12/13 may be crucial for breast cancer tumorigenesis, providing novel insights into developing detection biomarkers or targeted therapies for breast cancer. Nevertheless, evidence from clinical applications such as in vitro data or large patient cohorts should be produced to validate associations between CDH1/2/4/11/12/13 and breast cancer.
Conclusions
CDH1/2/4/11/12/13 were overexpressed in breast cancer and were associated with poor prognoses in the distant metastasis-free survival analysis. Genes coexpressed with these CDH family members were correlated with regulation of the EMT and cell adhesion ECM remodeling, which were validated as playing critical roles in tumor metastasis. Although further evidence of clinical correlations for validation in the future should be determined to support our hypothesis, CDH1/2/4/11/12/13 are expected to be potential biomarkers for breast cancer progression and metastasis.
Author Contributions
S.C.K., H.L.L., W.J.W., and C.Y.W. conceived the project and performed the bioinformatics analysis. S.C.K., H.L.L., C.Y.S., I.J.Y., M.C.Y., and wrote the manuscript. G.A., H.D.K.T., C.C.C., D.T.M.X., and F.B.P. performed the data analysis. W.J.W. and C.Y.W. were responsible for manuscript editing and revised the manuscript. All authors have read and agreed to the published version of the manuscript.
Acknowledgments
The authors acknowledge the statistical/computational/technical support of the Clinical Data Center, Office of Data Science, Taipei Medical University, Taipei, Taiwan. The authors also give special thanks to Daniel P. Chamberlin for his professional English editing from the Office of Research and Development at Taipei Medical University.
Conflicts of Interest
The authors declare that no conflicts of interest exist.
Funding
This research was supported by grants from the Ministry of Science and Technology (MOST) of Taiwan (MOST-110-2320-B-039-068 to W-J.W. and 109-2320-B-038-009-MY2 to C-Y.W.), China Medical University (CMU110-MF-47 to W-J.W.), Taipei Medical University (TMU-108-AE1-B16), Taipei Medical University Hospital (111TMU-TMUH-08), and this work was financially supported by the “TMU Research Center of Cancer Translational Medicine” from The Featured Areas Research Center Program within the framework of the Higher Education Sprout Project by the Ministry of Education (MOE) in Taiwan.
References
- 1. Gulmez A. Breast cancer after multiple myeloma treatment. Curr Probl Cancer. 2019; 43:100463. https://doi.org/10.1016/j.currproblcancer.2019.01.004 [PubMed]
- 2. Bray F, Ferlay J, Soerjomataram I, Siegel RL, Torre LA, Jemal A. Global cancer statistics 2018: GLOBOCAN estimates of incidence and mortality worldwide for 36 cancers in 185 countries. CA Cancer J Clin. 2018; 68:394–424. https://doi.org/10.3322/caac.21492 [PubMed]
- 3. Falzone L, Grimaldi M, Celentano E, Augustin LS, Libra M. Identification of Modulated MicroRNAs Associated with Breast Cancer, Diet, and Physical Activity. Cancers (Basel). 2020; 12:2555. https://doi.org/10.3390/cancers12092555 [PubMed]
- 4. Wu M, Li Q, Wang H. Identification of Novel Biomarkers Associated With the Prognosis and Potential Pathogenesis of Breast Cancer via Integrated Bioinformatics Analysis. Technol Cancer Res Treat. 2021. https://doi.org/10.1177/1533033821992081 [PubMed]
- 5. Pan Y, Liu G, Yuan Y, Zhao J, Yang Y, Li Y. Analysis of differential gene expression profile identifies novel biomarkers for breast cancer. Oncotarget. 2017; 8:114613–25. https://doi.org/10.18632/oncotarget.23061 [PubMed]
- 6. Li CJ, Chen HM, Lai JC. Diagnostic, Prognostic, and Predictive Biomarkers in Breast Cancer. J Oncol. 2020; 2020:1835691. https://doi.org/10.1155/2020/1835691 [PubMed]
- 7. Paul A, Paul S. The breast cancer susceptibility genes (BRCA) in breast and ovarian cancers. Front Biosci (Landmark Ed). 2014; 19:605–18. https://doi.org/10.2741/4230 [PubMed]
- 8. van de Vijver MJ, He YD, van’t Veer LJ, Dai H, Hart AA, Voskuil DW, Schreiber GJ, Peterse JL, Roberts C, Marton MJ, Parrish M, Atsma D, Witteveen A, et al. A gene-expression signature as a predictor of survival in breast cancer. N Engl J Med. 2002; 347:1999–2009. https://doi.org/10.1056/NEJMoa021967 [PubMed]
- 9. Sultan G, Zubair S, Tayubi IA, Dahms HU, Madar IH. Towards the early detection of ductal carcinoma (a common type of breast cancer) using biomarkers linked to the PPAR(γ) signaling pathway. Bioinformation. 2019; 15:799–805. https://doi.org/10.6026/97320630015799 [PubMed]
- 10. Fahad Ullah M. Breast Cancer: Current Perspectives on the Disease Status. Adv Exp Med Biol. 2019; 1152:51–64. https://doi.org/10.1007/978-3-030-20301-6_4 [PubMed]
- 11. Sever R, Brugge JS. Signal transduction in cancer. Cold Spring Harb Perspect Med. 2015; 5:a006098. https://doi.org/10.1101/cshperspect.a006098 [PubMed]
- 12. Chakravarthi BV, Nepal S, Varambally S. Genomic and Epigenomic Alterations in Cancer. Am J Pathol. 2016; 186:1724–35. https://doi.org/10.1016/j.ajpath.2016.02.023 [PubMed]
- 13. Herceg Z, Hainaut P. Genetic and epigenetic alterations as biomarkers for cancer detection, diagnosis and prognosis. Mol Oncol. 2007; 1:26–41. https://doi.org/10.1016/j.molonc.2007.01.004 [PubMed]
- 14. Kaszak I, Witkowska-Piłaszewicz O, Niewiadomska Z, Dworecka-Kaszak B, Ngosa Toka F, Jurka P. Role of Cadherins in Cancer-A Review. Int J Mol Sci. 2020; 21:7624. https://doi.org/10.3390/ijms21207624 [PubMed]
- 15. de Agustín-Durán D, Mateos-White I, Fabra-Beser J, Gil-Sanz C. Stick around: Cell-Cell Adhesion Molecules during Neocortical Development. Cells. 2021; 10:118. https://doi.org/10.3390/cells10010118 [PubMed]
- 16. Stelzer G, Rosen N, Plaschkes I, Zimmerman S, Twik M, Fishilevich S, Stein TI, Nudel R, Lieder I, Mazor Y, Kaplan S, Dahary D, Warshawsky D, et al. The GeneCards Suite: From Gene Data Mining to Disease Genome Sequence Analyses. Curr Protoc Bioinformatics. 2016; 54:1.30. https://doi.org/10.1002/cpbi.5 [PubMed]
- 17. Takeichi M. Cadherin cell adhesion receptors as a morphogenetic regulator. Science. 1991; 251:1451–5. https://doi.org/10.1126/science.2006419 [PubMed]
- 18. Yu W, Yang L, Li T, Zhang Y. Cadherin Signaling in Cancer: Its Functions and Role as a Therapeutic Target. Front Oncol. 2019; 9:989. https://doi.org/10.3389/fonc.2019.00989 [PubMed]
- 19. Thiery JP. Epithelial-mesenchymal transitions in tumour progression. Nat Rev Cancer. 2002; 2:442–54. https://doi.org/10.1038/nrc822 [PubMed]
- 20. Kalluri R, Neilson EG. Epithelial-mesenchymal transition and its implications for fibrosis. J Clin Invest. 2003; 112:1776–84. https://doi.org/10.1172/JCI20530 [PubMed]
- 21. de Vasconcelos Azevedo FVP, Zóia MAP, Lopes DS, Gimenes SN, Vecchi L, Alves PT, Rodrigues RS, Silva ACA, Yoneyama KAG, Goulart LR, de Melo Rodrigues V. Antitumor and antimetastatic effects of PLA2-BthTX-II from Bothrops jararacussu venom on human breast cancer cells. Int J Biol Macromol. 2019; 135:261–73. https://doi.org/10.1016/j.ijbiomac.2019.05.164 [PubMed]
- 22. Fujii R, Imanishi Y, Shibata K, Sakai N, Sakamoto K, Shigetomi S, Habu N, Otsuka K, Sato Y, Watanabe Y, Ozawa H, Tomita T, Kameyama K, et al. Restoration of E-cadherin expression by selective Cox-2 inhibition and the clinical relevance of the epithelial-to-mesenchymal transition in head and neck squamous cell carcinoma. J Exp Clin Cancer Res. 2014; 33:40. https://doi.org/10.1186/1756-9966-33-40 [PubMed]
- 23. Ribatti D, Tamma R, Annese T. Epithelial-Mesenchymal Transition in Cancer: A Historical Overview. Transl Oncol. 2020; 13:100773. https://doi.org/10.1016/j.tranon.2020.100773 [PubMed]
- 24. Chu K, Boley KM, Moraes R, Barsky SH, Robertson FM. The paradox of E-cadherin: role in response to hypoxia in the tumor microenvironment and regulation of energy metabolism. Oncotarget. 2013; 4:446–62. https://doi.org/10.18632/oncotarget.872 [PubMed]
- 25. Kemler R, Hierholzer A, Kanzler B, Kuppig S, Hansen K, Taketo MM, de Vries WN, Knowles BB, Solter D. Stabilization of beta-catenin in the mouse zygote leads to premature epithelial-mesenchymal transition in the epiblast. Development. 2004; 131:5817–24. https://doi.org/10.1242/dev.01458 [PubMed]
- 26. Klymkowsky MW. beta-catenin and its regulatory network. Hum Pathol. 2005; 36:225–7. https://doi.org/10.1016/j.humpath.2005.02.002 [PubMed]
- 27. Thorat MA, Balasubramanian R. Breast cancer prevention in high-risk women. Best Pract Res Clin Obstet Gynaecol. 2020; 65:18–31. https://doi.org/10.1016/j.bpobgyn.2019.11.006 [PubMed]
- 28. Lin CY, Lee CH, Chuang YH, Lee JY, Chiu YY, Wu Lee YH, Jong YJ, Hwang JK, Huang SH, Chen LC, Wu CH, Tu SH, Ho YS, Yang JM. Membrane protein-regulated networks across human cancers. Nat Commun. 2019; 10:3131. https://doi.org/10.1038/s41467-019-10920-8 [PubMed]
- 29. Tsai HT, Huang CS, Tu CC, Liu CY, Huang CJ, Ho YS, Tu SH, Tseng LM, Huang CC. Multi-gene signature of microcalcification and risk prediction among Taiwanese breast cancer. Sci Rep. 2020; 10:18276. https://doi.org/10.1038/s41598-020-74982-1 [PubMed]
- 30. Nguyen HD, Liao YC, Ho YS, Chen LC, Chang HW, Cheng TC, Liu D, Lee WR, Shen SC, Wu CH, Tu SH. The α9 Nicotinic Acetylcholine Receptor Mediates Nicotine-Induced PD-L1 Expression and Regulates Melanoma Cell Proliferation and Migration. Cancers (Basel). 2019; 11:1991. https://doi.org/10.3390/cancers11121991 [PubMed]
- 31. Lee KL, Kuo YC, Ho YS, Huang YH. Triple-Negative Breast Cancer: Current Understanding and Future Therapeutic Breakthrough Targeting Cancer Stemness. Cancers (Basel). 2019; 11:1334. https://doi.org/10.3390/cancers11091334 [PubMed]
- 32. Rhodes DR, Yu J, Shanker K, Deshpande N, Varambally R, Ghosh D, Barrette T, Pandey A, Chinnaiyan AM. ONCOMINE: a cancer microarray database and integrated data-mining platform. Neoplasia. 2004; 6:1–6. https://doi.org/10.1016/s1476-5586(04)80047-2 [PubMed]
- 33. Kao TJ, Wu CC, Phan NN, Liu YH, Ta HD, Anuraga G, Wu YF, Lee KH, Chuang JY, Wang CY. Prognoses and genomic analyses of proteasome 26S subunit, ATPase (PSMC) family genes in clinical breast cancer. Aging (Albany NY). 2021; 13:17970. https://doi.org/10.18632/aging.203345 [PubMed]
- 34. Wu PS, Yen JH, Wang CY, Chen PY, Hung JH, Wu MJ. 8-Hydroxydaidzein, an Isoflavone from Fermented Soybean, Induces Autophagy, Apoptosis, Differentiation, and Degradation of Oncoprotein BCR-ABL in K562 Cells. Biomedicines. 2020; 8:506. https://doi.org/10.3390/biomedicines8110506 [PubMed]
- 35. Wu CC, Ekanem TI, Phan NN, Loan DT, Hou SY, Lee KH, Wang CY. Gene signatures and prognostic analyses of the Tob/BTG pituitary tumor-transforming gene (PTTG) family in clinical breast cancer patients. Int J Med Sci. 2020; 17:3112–24. https://doi.org/10.7150/ijms.49652 [PubMed]
- 36. Lin YY, Wang CY, Phan NN, Chiao CC, Li CY, Sun Z, Hung JH, Chen YL, Yen MC, Weng TY, Hsu HP, Lai MD. PODXL2 maintains cellular stemness and promotes breast cancer development through the Rac1/Akt pathway. Int J Med Sci. 2020; 17:1639–51. https://doi.org/10.7150/ijms.46125 [PubMed]
- 37. Hsu HP, Wang CY, Hsieh PY, Fang JH, Chen YL. Knockdown of serine/threonine-protein kinase 24 promotes tumorigenesis and myeloid-derived suppressor cell expansion in an orthotopic immunocompetent gastric cancer animal model. J Cancer. 2020; 11:213–28. https://doi.org/10.7150/jca.35821 [PubMed]
- 38. Tang Z, Kang B, Li C, Chen T, Zhang Z. GEPIA2: an enhanced web server for large-scale expression profiling and interactive analysis. Nucleic Acids Res. 2019; 47:W556–60. https://doi.org/10.1093/nar/gkz430 [PubMed]
- 39. Barrett T, Wilhite SE, Ledoux P, Evangelista C, Kim IF, Tomashevsky M, Marshall KA, Phillippy KH, Sherman PM, Holko M, Yefanov A, Lee H, Zhang N, et al. NCBI GEO: archive for functional genomics data sets--update. Nucleic Acids Res. 2013; 41:D991–5. https://doi.org/10.1093/nar/gks1193 [PubMed]
- 40. Lin JC, Liu TP, Yang PM. CDKN2A-Inactivated Pancreatic Ductal Adenocarcinoma Exhibits Therapeutic Sensitivity to Paclitaxel: A Bioinformatics Study. J Clin Med. 2020; 9:4019. https://doi.org/10.3390/jcm9124019 [PubMed]
- 41. Lin TY, Wang PW, Huang CH, Yang PM, Pan TL. Characterizing the Relapse Potential in Different Luminal Subtypes of Breast Cancers with Functional Proteomics. Int J Mol Sci. 2020; 21:6077. https://doi.org/10.3390/ijms21176077 [PubMed]
- 42. Liu LW, Hsieh YY, Yang PM. Bioinformatics Data Mining Repurposes the JAK2 (Janus Kinase 2) Inhibitor Fedratinib for Treating Pancreatic Ductal Adenocarcinoma by Reversing the KRAS (Kirsten Rat Sarcoma 2 Viral Oncogene Homolog)-Driven Gene Signature. J Pers Med. 2020; 10:130. https://doi.org/10.3390/jpm10030130 [PubMed]
- 43. Yang PM, Hsieh YY, Du JL, Yen SC, Hung CF. Sequential Interferon β-Cisplatin Treatment Enhances the Surface Exposure of Calreticulin in Cancer Cells via an Interferon Regulatory Factor 1-Dependent Manner. Biomolecules. 2020; 10:643. https://doi.org/10.3390/biom10040643 [PubMed]
- 44. Yang PM, Lin LS, Liu TP. Sorafenib Inhibits Ribonucleotide Reductase Regulatory Subunit M2 (RRM2) in Hepatocellular Carcinoma Cells. Biomolecules. 2020; 10:117. https://doi.org/10.3390/biom10010117 [PubMed]
- 45. Nagy Á, Munkácsy G, Győrffy B. Pancancer survival analysis of cancer hallmark genes. Sci Rep. 2021; 11:6047. https://doi.org/10.1038/s41598-021-84787-5 [PubMed]
- 46. Lánczky A, Nagy Á, Bottai G, Munkácsy G, Szabó A, Santarpia L, Győrffy B. miRpower: a web-tool to validate survival-associated miRNAs utilizing expression data from 2178 breast cancer patients. Breast Cancer Res Treat. 2016; 160:439–46. https://doi.org/10.1007/s10549-016-4013-7 [PubMed]
- 47. Gao J, Aksoy BA, Dogrusoz U, Dresdner G, Gross B, Sumer SO, Sun Y, Jacobsen A, Sinha R, Larsson E, Cerami E, Sander C, Schultz N. Integrative analysis of complex cancer genomics and clinical profiles using the cBioPortal. Sci Signal. 2013; 6:pl1. https://doi.org/10.1126/scisignal.2004088 [PubMed]
- 48. Sun CC, Li SJ, Hu W, Zhang J, Zhou Q, Liu C, Li LL, Songyang YY, Zhang F, Chen ZL, Li G, Bi ZY, Bi YY, et al. RETRACTED: Comprehensive Analysis of the Expression and Prognosis for E2Fs in Human Breast Cancer. Mol Ther. 2019; 27:1153–65. https://doi.org/10.1016/j.ymthe.2019.03.019 [PubMed]
- 49. Hagerling C, Owyong M, Sitarama V, Wang CY, Lin C, van den Bijgaart RJ, Koopman CD, Brenot A, Nanjaraj A, Wärnberg F, Jirström K, Klein OD, Werb Z, Plaks V. LGR5 in breast cancer and ductal carcinoma in situ: a diagnostic and prognostic biomarker and a therapeutic target. BMC Cancer. 2020; 20:542. https://doi.org/10.1186/s12885-020-06986-z [PubMed]
- 50. Phan NN, Liu S, Wang CY, Hsu HP, Lai MD, Li CY, Chen CF, Chiao CC, Yen MC, Sun Z, Jiang JZ. Overexpressed gene signature of EPH receptor A/B family in cancer patients-comprehensive analyses from the public high-throughput database. Int J Clin Exp Pathol. 2020; 13:1220–42. [PubMed]
- 51. Uhlén M, Fagerberg L, Hallström BM, Lindskog C, Oksvold P, Mardinoglu A, Sivertsson Å, Kampf C, Sjöstedt E, Asplund A, Olsson I, Edlund K, Lundberg E, et al. Proteomics. Tissue-based map of the human proteome. Science. 2015; 347:1260419. https://doi.org/10.1126/science.1260419 [PubMed]
- 52. Jézéquel P, Gouraud W, Ben Azzouz F, Guérin-Charbonnel C, Juin PP, Lasla H, Campone M. bc-GenExMiner 4.5: new mining module computes breast cancer differential gene expression analyses. Database (Oxford). 2021; 2021:baab007. https://doi.org/10.1093/database/baab007 [PubMed]
- 53. Barretina J, Caponigro G, Stransky N, Venkatesan K, Margolin AA, Kim S, Wilson CJ, Lehár J, Kryukov GV, Sonkin D, Reddy A, Liu M, Murray L, et al. The Cancer Cell Line Encyclopedia enables predictive modelling of anticancer drug sensitivity. Nature. 2012; 483:603–7. https://doi.org/10.1038/nature11003 [PubMed]
- 54. Lawal B, Liu YL, Mokgautsi N, Khedkar H, Sumitra MR, Wu AT, Huang HS. Pharmacoinformatics and Preclinical Studies of NSC765690 and NSC765599, Potential STAT3/CDK2/4/6 Inhibitors with Antitumor Activities against NCI60 Human Tumor Cell Lines. Biomedicines. 2021; 9:92. https://doi.org/10.3390/biomedicines9010092 [PubMed]
- 55. Lawal B, Lee CY, Mokgautsi N, Sumitra MR, Khedkar H, Wu AT, Huang HS. mTOR/EGFR/iNOS/MAP2K1/FGFR/TGFB1 Are Druggable Candidates for N-(2,4-Difluorophenyl)-2’,4’-Difluoro-4-Hydroxybiphenyl-3-Carboxamide (NSC765598), With Consequent Anticancer Implications. Front Oncol. 2021; 11:656738. https://doi.org/10.3389/fonc.2021.656738 [PubMed]
- 56. Lawal B, Kuo YC, Sumitra MR, Wu AT, Huang HS. In vivo Pharmacokinetic and Anticancer Studies of HH-N25, a Selective Inhibitor of Topoisomerase I, and Hormonal Signaling for Treating Breast Cancer. J Inflamm Res. 2021; 14:4901–13. https://doi.org/10.2147/JIR.S329401 [PubMed]
- 57. Lawal B, Kuo YC, Wu AT, Huang HS. BC-N102 suppress breast cancer tumorigenesis by interfering with cell cycle regulatory proteins and hormonal signaling, and induction of time-course arrest of cell cycle at G1/G0 phase. Int J Biol Sci. 2021; 17:3224–38. https://doi.org/10.7150/ijbs.62808 [PubMed]
- 58. Modhukur V, Iljasenko T, Metsalu T, Lokk K, Laisk-Podar T, Vilo J. MethSurv: a web tool to perform multivariable survival analysis using DNA methylation data. Epigenomics. 2018; 10:277–88. https://doi.org/10.2217/epi-2017-0118 [PubMed]
- 59. Curtis C, Shah SP, Chin SF, Turashvili G, Rueda OM, Dunning MJ, Speed D, Lynch AG, Samarajiwa S, Yuan Y, Gräf S, Ha G, Haffari G, et al, and METABRIC Group. The genomic and transcriptomic architecture of 2,000 breast tumours reveals novel subgroups. Nature. 2012; 486:346–52. https://doi.org/10.1038/nature10983 [PubMed]
- 60. Cancer Genome Atlas Network. Comprehensive molecular portraits of human breast tumours. Nature. 2012; 490:61–70. https://doi.org/10.1038/nature11412 [PubMed]
- 61. Anuraga G, Wang WJ, Phan NN, An Ton NT, Ta HD, Berenice Prayugo F, Minh Xuan DT, Ku SC, Wu YF, Andriani V, Athoillah M, Lee KH, Wang CY. Potential Prognostic Biomarkers of NIMA (Never in Mitosis, Gene A)-Related Kinase (NEK) Family Members in Breast Cancer. J Pers Med. 2021; 11:1089. https://doi.org/10.3390/jpm11111089 [PubMed]
- 62. Khoa Ta HD, Tang WC, Phan NN, Anuraga G, Hou SY, Chiao CC, Liu YH, Wu YF, Lee KH, Wang CY. Analysis of LAGEs Family Gene Signature and Prognostic Relevance in Breast Cancer. Diagnostics (Basel). 2021; 11:726. https://doi.org/10.3390/diagnostics11040726 [PubMed]
- 63. Ta HD, Wang WJ, Phan NN, An Ton NT, Anuraga G, Ku SC, Wu YF, Wang CY, Lee KH. Potential Therapeutic and Prognostic Values of LSM Family Genes in Breast Cancer. Cancers (Basel). 2021; 13:4902. https://doi.org/10.3390/cancers13194902 [PubMed]
- 64. Wu YH, Yeh IJ, Phan NN, Yen MC, Liu HL, Wang CY, Hsu HP. Severe acute respiratory syndrome coronavirus (SARS-CoV)-2 infection induces dysregulation of immunity: in silico gene expression analysis. Int J Med Sci. 2021; 18:1143–52. https://doi.org/10.7150/ijms.52256 [PubMed]
- 65. Liu HL, Yeh IJ, Phan NN, Wu YH, Yen MC, Hung JH, Chiao CC, Chen CF, Sun Z, Jiang JZ, Hsu HP, Wang CY, Lai MD. Gene signatures of SARS-CoV/SARS-CoV-2-infected ferret lungs in short- and long-term models. Infect Genet Evol. 2020; 85:104438. https://doi.org/10.1016/j.meegid.2020.104438 [PubMed]
- 66. Liu CH, Lu CH, Lin LT. Pandemic strategies with computational and structural biology against COVID-19: A retrospective. Comput Struct Biotechnol J. 2021; 20:187–92. https://doi.org/10.1016/j.csbj.2021.11.040 [PubMed]
- 67. Lim HG, Hsiao SH, Fann YC, Lee YG. Robust Mutation Profiling of SARS-CoV-2 Variants from Multiple Raw Illumina Sequencing Data with Cloud Workflow. Genes (Basel). 2022; 13:686. https://doi.org/10.3390/genes13040686 [PubMed]
- 68. Yu WL, Toh HS, Liao CT, Chang WT. A Double-Edged Sword-Cardiovascular Concerns of Potential Anti-COVID-19 Drugs. Cardiovasc Drugs Ther. 2021; 35:205–14. https://doi.org/10.1007/s10557-020-07024-7 [PubMed]
- 69. Poly TN, Islam MM, Li YJ, Alsinglawi B, Hsu MH, Jian WS, Yang HC. Application of Artificial Intelligence for Screening COVID-19 Patients Using Digital Images: Meta-analysis. JMIR Med Inform. 2021; 9:e21394. https://doi.org/10.2196/21394 [PubMed]
- 70. Yu CS, Chang SS, Chang TH, Wu JL, Lin YJ, Chien HF, Chen RJ. A COVID-19 Pandemic Artificial Intelligence-Based System With Deep Learning Forecasting and Automatic Statistical Data Acquisition: Development and Implementation Study. J Med Internet Res. 2021; 23:e27806. https://doi.org/10.2196/27806 [PubMed]
- 71. Boyle EI, Weng S, Gollub J, Jin H, Botstein D, Cherry JM, Sherlock G. GO::TermFinder--open source software for accessing Gene Ontology information and finding significantly enriched Gene Ontology terms associated with a list of genes. Bioinformatics. 2004; 20:3710–5. https://doi.org/10.1093/bioinformatics/bth456 [PubMed]
- 72. Wang CY, Chiao CC, Phan NN, Li CY, Sun ZD, Jiang JZ, Hung JH, Chen YL, Yen MC, Weng TY, Chen WC, Hsu HP, Lai MD. Gene signatures and potential therapeutic targets of amino acid metabolism in estrogen receptor-positive breast cancer. Am J Cancer Res. 2020; 10:95–113. [PubMed]
- 73. Xuan DT, Yeh IJ, Wu CC, Su CY, Liu HL, Chiao CC, Ku SC, Jiang JZ, Sun Z, Ta HD, Anuraga G, Wang CY, Yen MC. Comparison of Transcriptomic Signatures between Monkeypox-Infected Monkey and Human Cell Lines. J Immunol Res. 2022; 2022:3883822. https://doi.org/10.1155/2022/3883822 [PubMed]
- 74. Sergushichev A. An algorithm for fast preranked gene set enrichment analysis using cumulative statistic calculation. BioRxiv. 2016. [Epub ahead of print].
- 75. Korotkevich G, Sukhov V, Budin N, Shpak B, Artyomov MN, Sergushichev A. Fast gene set enrichment analysis. BioRxiv. 2021. [Epub ahead of print]. https://doi.org/10.1101/060012
- 76. Chen PS, Hsu HP, Phan NN, Yen MC, Chen FW, Liu YW, Lin FP, Feng SY, Cheng TL, Yeh PH, Omar HA, Sun Z, Jiang JZ, et al. CCDC167 as a potential therapeutic target and regulator of cell cycle-related networks in breast cancer. Aging (Albany NY). 2021; 13:4157–81. https://doi.org/10.18632/aging.202382 [PubMed]
- 77. Bakre A, Andersen LE, Meliopoulos V, Coleman K, Yan X, Brooks P, Crabtree J, Tompkins SM, Tripp RA. Identification of Host Kinase Genes Required for Influenza Virus Replication and the Regulatory Role of MicroRNAs. PLoS One. 2013; 8:e66796. https://doi.org/10.1371/journal.pone.0066796 [PubMed]
- 78. Fujiwara Y, Saito M, Robles AI, Nishida M, Takeshita F, Watanabe M, Ochiya T, Yokota J, Kohno T, Harris CC, Tsuchiya N. A Nucleolar Stress-Specific p53-miR-101 Molecular Circuit Functions as an Intrinsic Tumor-Suppressor Network. EBioMedicine. 2018; 33:33–48. https://doi.org/10.1016/j.ebiom.2018.06.031 [PubMed]
- 79. Wu YH, Yeh IJ, Phan NN, Yen MC, Hung JH, Chiao CC, Chen CF, Sun Z, Hsu HP, Wang CY, Lai MD. Gene signatures and potential therapeutic targets of Middle East respiratory syndrome coronavirus (MERS-CoV)-infected human lung adenocarcinoma epithelial cells. J Microbiol Immunol Infect. 2021; 54:845–57. https://doi.org/10.1016/j.jmii.2021.03.007 [PubMed]
- 80. Li T, Fan J, Wang B, Traugh N, Chen Q, Liu JS, Li B, Liu XS. TIMER: A Web Server for Comprehensive Analysis of Tumor-Infiltrating Immune Cells. Cancer Res. 2017; 77:e108–10. https://doi.org/10.1158/0008-5472.CAN-17-0307 [PubMed]
- 81. Li B, Severson E, Pignon JC, Zhao H, Li T, Novak J, Jiang P, Shen H, Aster JC, Rodig S, Signoretti S, Liu JS, Liu XS. Comprehensive analyses of tumor immunity: implications for cancer immunotherapy. Genome Biol. 2016; 17:174. https://doi.org/10.1186/s13059-016-1028-7 [PubMed]
- 82. Amat S, Penault-Llorca F, Cure H, Le Bouedëc G, Achard JL, Van Praagh I, Feillel V, Mouret-Reynier MA, Dauplat J, Chollet P. Scarff-Bloom-Richardson (SBR) grading: a pleiotropic marker of chemosensitivity in invasive ductal breast carcinomas treated by neoadjuvant chemotherapy. Int J Oncol. 2002; 20:791–6. [PubMed]
- 83. Galea MH, Blamey RW, Elston CE, Ellis IO. The Nottingham Prognostic Index in primary breast cancer. Breast Cancer Res Treat. 1992; 22:207–19. https://doi.org/10.1007/BF01840834 [PubMed]
- 84. Chava S, Gupta R. Identification of the Mutational Landscape of Gynecological Malignancies. J Cancer. 2020; 11:4870–83. https://doi.org/10.7150/jca.46174 [PubMed]
- 85. Yang SY, Lheureux S, Karakasis K, Burnier JV, Bruce JP, Clouthier DL, Danesh A, Quevedo R, Dowar M, Hanna Y, Li T, Lu L, Xu W, et al. Landscape of genomic alterations in high-grade serous ovarian cancer from exceptional long- and short-term survivors. Genome Med. 2018; 10:81. https://doi.org/10.1186/s13073-018-0590-x [PubMed]
- 86. Ciriello G, Gatza ML, Beck AH, Wilkerson MD, Rhie SK, Pastore A, Zhang H, McLellan M, Yau C, Kandoth C, Bowlby R, Shen H, Hayat S, et al, and TCGA Research Network. Comprehensive Molecular Portraits of Invasive Lobular Breast Cancer. Cell. 2015; 163:506–19. https://doi.org/10.1016/j.cell.2015.09.033 [PubMed]
- 87. Dabbs DJ, Schnitt SJ, Geyer FC, Weigelt B, Baehner FL, Decker T, Eusebi V, Fox SB, Ichihara S, Lakhani SR, Palacios J, Rakha E, Richardson AL, et al. Lobular neoplasia of the breast revisited with emphasis on the role of E-cadherin immunohistochemistry. Am J Surg Pathol. 2013; 37:e1–11. https://doi.org/10.1097/PAS.0b013e3182918a2b [PubMed]
- 88. Gregory PA, Bert AG, Paterson EL, Barry SC, Tsykin A, Farshid G, Vadas MA, Khew-Goodall Y, Goodall GJ. The miR-200 family and miR-205 regulate epithelial to mesenchymal transition by targeting ZEB1 and SIP1. Nat Cell Biol. 2008; 10:593–601. https://doi.org/10.1038/ncb1722 [PubMed]
- 89. Park SM, Gaur AB, Lengyel E, Peter ME. The miR-200 family determines the epithelial phenotype of cancer cells by targeting the E-cadherin repressors ZEB1 and ZEB2. Genes Dev. 2008; 22:894–907. https://doi.org/10.1101/gad.1640608 [PubMed]
- 90. Korpal M, Lee ES, Hu G, Kang Y. The miR-200 family inhibits epithelial-mesenchymal transition and cancer cell migration by direct targeting of E-cadherin transcriptional repressors ZEB1 and ZEB2. J Biol Chem. 2008; 283:14910–4. https://doi.org/10.1074/jbc.C800074200 [PubMed]
- 91. Fontana A, Barbano R, Dama E, Pasculli B, Rendina M, Morritti MG, Melocchi V, Castelvetere M, Valori VM, Ravaioli S, Bravaccini S, Ciuffreda L, Graziano P, et al. Combined analysis of miR-200 family and its significance for breast cancer. Sci Rep. 2021; 11:2980. https://doi.org/10.1038/s41598-021-82286-1 [PubMed]
- 92. Thiery JP. Epithelial-mesenchymal transitions in development and pathologies. Curr Opin Cell Biol. 2003; 15:740–6. https://doi.org/10.1016/j.ceb.2003.10.006 [PubMed]
- 93. Nakajima S, Doi R, Toyoda E, Tsuji S, Wada M, Koizumi M, Tulachan SS, Ito D, Kami K, Mori T, Kawaguchi Y, Fujimoto K, Hosotani R, Imamura M. N-cadherin expression and epithelial-mesenchymal transition in pancreatic carcinoma. Clin Cancer Res. 2004; 10:4125–33. https://doi.org/10.1158/1078-0432.CCR-0578-03 [PubMed]
- 94. Hazan RB, Qiao R, Keren R, Badano I, Suyama K. Cadherin switch in tumor progression. Ann N Y Acad Sci. 2004; 1014:155–63. https://doi.org/10.1196/annals.1294.016 [PubMed]
- 95. Bartolomé RA, Torres S, Isern de Val S, Escudero-Paniagua B, Calviño E, Teixidó J, Casal JI. VE-cadherin RGD motifs promote metastasis and constitute a potential therapeutic target in melanoma and breast cancers. Oncotarget. 2017; 8:215–27. https://doi.org/10.18632/oncotarget.13832 [PubMed]
- 96. Huang TH, Mokgautsi N, Huang YJ, Wu AT, Huang HS. Comprehensive Omics Analysis of a Novel Small-Molecule Inhibitor of Chemoresistant Oncogenic Signatures in Colorectal Cancer Cell with Antitumor Effects. Cells. 2021; 10:1970. https://doi.org/10.3390/cells10081970 [PubMed]
- 97. Yadav VK, Huang YJ, George TA, Wei PL, Sumitra MR, Ho CL, Chang TH, Wu AT, Huang HS. Preclinical Evaluation of the Novel Small-Molecule MSI-N1014 for Treating Drug-Resistant Colon Cancer via the LGR5/β-catenin/miR-142-3p Network and Reducing Cancer-Associated Fibroblast Transformation. Cancers (Basel). 2020; 12:1590. https://doi.org/10.3390/cancers12061590 [PubMed]
- 98. Lawal B, Wang YC, Wu AT, Huang HS. Pro-Oncogenic c-Met/EGFR, Biomarker Signatures of the Tumor Microenvironment are Clinical and Therapy Response Prognosticators in Colorectal Cancer, and Therapeutic Targets of 3-Phenyl-2H-benzo[e][1,3]-Oxazine-2,4(3H)-Dione Derivatives. Front Pharmacol. 2021; 12:691234. https://doi.org/10.3389/fphar.2021.691234 [PubMed]
- 99. Chung CC, Huang TY, Chu HR, De Luca R, Candelotti E, Huang CH, Yang YS, Incerpi S, Pedersen JZ, Lin CY, Huang HM, Lee SY, Li ZL, et al. Heteronemin and tetrac derivatives suppress non-small cell lung cancer growth via ERK1/2 inhibition. Food Chem Toxicol. 2022; 161:112850. https://doi.org/10.1016/j.fct.2022.112850 [PubMed]
- 100. Hsiao SH, Chen WT, Chung CL, Chou YT, Lin SE, Hong SY, Chang JH, Chang TH, Chien LN. Comparative survival analysis of platinum-based adjuvant chemotherapy for early-stage squamous cell carcinoma and adenocarcinoma of the lung. Cancer Med. 2022; 11:2067–78. https://doi.org/10.1002/cam4.4570 [PubMed]
- 101. Kuo KT, Lin CH, Wang CH, Pikatan NW, Yadav VK, Fong IH, Yeh CT, Lee WH, Huang WC. HNMT Upregulation Induces Cancer Stem Cell Formation and Confers Protection against Oxidative Stress through Interaction with HER2 in Non-Small-Cell Lung Cancer. Int J Mol Sci. 2022; 23:1663. https://doi.org/10.3390/ijms23031663 [PubMed]
- 102. Tseng PC, Chen CL, Lee KY, Feng PH, Wang YC, Satria RD, Lin CF. Epithelial-to-mesenchymal transition hinders interferon-γ-dependent immunosurveillance in lung cancer cells. Cancer Lett. 2022; 539:215712. https://doi.org/10.1016/j.canlet.2022.215712 [PubMed]
- 103. Lee HC, Lu YH, Huang YL, Huang SL, Chuang HC. Air Pollution Effects to the Subtype and Severity of Lung Cancers. Front Med (Lausanne). 2022; 9:835026. https://doi.org/10.3389/fmed.2022.835026 [PubMed]
- 104. Chen YL, Lee KT, Wang CY, Shen CH, Chen SC, Chung WP, Hsu YT, Kuo YL, Chen PS, Cheung CH, Chang CP, Shen MR, Hsu HP. Low expression of cytosolic NOTCH1 predicts poor prognosis of breast cancer patients. Am J Cancer Res. 2022; 12:2084–101. [PubMed]
- 105. Hagerling C, Gonzalez H, Salari K, Wang CY, Lin C, Robles I, van Gogh M, Dejmek A, Jirström K, Werb Z. Immune effector monocyte-neutrophil cooperation induced by the primary tumor prevents metastatic progression of breast cancer. Proc Natl Acad Sci USA. 2019; 116:21704–14. https://doi.org/10.1073/pnas.1907660116 [PubMed]
- 106. Wang WJ, Lai HY, Zhang F, Shen WJ, Chu PY, Liang HY, Liu YB, Wang JM. MCL1 participates in leptin-promoted mitochondrial fusion and contributes to drug resistance in gallbladder cancer. JCI Insight. 2021; 6:e135438. https://doi.org/10.1172/jci.insight.135438 [PubMed]
- 107. Chou CW, Hsieh YH, Ku SC, Shen WJ, Anuraga G, Khoa Ta HD, Lee KH, Lee YC, Lin CH, Wang CY, Wang WJ. Potential Prognostic Biomarkers of OSBPL Family Genes in Patients with Pancreatic Ductal Adenocarcinoma. Biomedicines. 2021; 9:1601. https://doi.org/10.3390/biomedicines9111601 [PubMed]
- 108. Ramezani M, Baharzadeh F, Almasi A, Sadeghi M. A Systematic Review and Meta-Analysis: Evaluation of the β-Human Papillomavirus in Immunosuppressed Individuals with Cutaneous Squamous Cell Carcinoma. Biomedicine (Taipei). 2020; 10:1–10. https://doi.org/10.37796/2211-8039.1110 [PubMed]
- 109. Lindsey S, Langhans SA. Crosstalk of Oncogenic Signaling Pathways during Epithelial-Mesenchymal Transition. Front Oncol. 2014; 4:358. https://doi.org/10.3389/fonc.2014.00358 [PubMed]
- 110. Falzone L, Candido S, Salemi R, Basile MS, Scalisi A, McCubrey JA, Torino F, Signorelli SS, Montella M, Libra M. Computational identification of microRNAs associated to both epithelial to mesenchymal transition and NGAL/MMP-9 pathways in bladder cancer. Oncotarget. 2016; 7:72758–66. https://doi.org/10.18632/oncotarget.11805 [PubMed]
- 111. McCubrey JA, Fitzgerald TL, Yang LV, Lertpiriyapong K, Steelman LS, Abrams SL, Montalto G, Cervello M, Neri LM, Cocco L, Martelli AM, Laidler P, Dulińska-Litewka J, et al. Roles of GSK-3 and microRNAs on epithelial mesenchymal transition and cancer stem cells. Oncotarget. 2017; 8:14221–50. https://doi.org/10.18632/oncotarget.13991 [PubMed]
- 112. Lade-Keller J, Riber-Hansen R, Guldberg P, Schmidt H, Hamilton-Dutoit SJ, Steiniche T. E- to N-cadherin switch in melanoma is associated with decreased expression of phosphatase and tensin homolog and cancer progression. Br J Dermatol. 2013; 169:618–28. https://doi.org/10.1111/bjd.12426 [PubMed]
- 113. Araki K, Shimura T, Suzuki H, Tsutsumi S, Wada W, Yajima T, Kobayahi T, Kubo N, Kuwano H. E/N-cadherin switch mediates cancer progression via TGF-β-induced epithelial-to-mesenchymal transition in extrahepatic cholangiocarcinoma. Br J Cancer. 2011; 105:1885–93. https://doi.org/10.1038/bjc.2011.452 [PubMed]
- 114. Aleskandarany MA, Negm OH, Green AR, Ahmed MA, Nolan CC, Tighe PJ, Ellis IO, Rakha EA. Epithelial mesenchymal transition in early invasive breast cancer: an immunohistochemical and reverse phase protein array study. Breast Cancer Res Treat. 2014; 145:339–48. https://doi.org/10.1007/s10549-014-2927-5 [PubMed]
- 115. Gravdal K, Halvorsen OJ, Haukaas SA, Akslen LA. A switch from E-cadherin to N-cadherin expression indicates epithelial to mesenchymal transition and is of strong and independent importance for the progress of prostate cancer. Clin Cancer Res. 2007; 13:7003–11. https://doi.org/10.1158/1078-0432.CCR-07-1263 [PubMed]
- 116. Gröger CJ, Grubinger M, Waldhör T, Vierlinger K, Mikulits W. Meta-analysis of gene expression signatures defining the epithelial to mesenchymal transition during cancer progression. PLoS One. 2012; 7:e51136. https://doi.org/10.1371/journal.pone.0051136 [PubMed]
- 117. Thiery JP, Acloque H, Huang RY, Nieto MA. Epithelial-mesenchymal transitions in development and disease. Cell. 2009; 139:871–90. https://doi.org/10.1016/j.cell.2009.11.007 [PubMed]
- 118. Peinado H, Olmeda D, Cano A. Snail, Zeb and bHLH factors in tumour progression: an alliance against the epithelial phenotype? Nat Rev Cancer. 2007; 7:415–28. https://doi.org/10.1038/nrc2131 [PubMed]
- 119. Chen JH, Huang WC, Bamodu OA, Chang PM, Chao TY, Huang TH. Monospecific antibody targeting of CDH11 inhibits epithelial-to-mesenchymal transition and represses cancer stem cell-like phenotype by up-regulating miR-335 in metastatic breast cancer, in vitro and in vivo. BMC Cancer. 2019; 19:634. https://doi.org/10.1186/s12885-019-5811-1 [PubMed]
- 120. Kim NH, Choi SH, Lee TR, Lee CH, Lee AY. Cadherin 11, a miR-675 target, induces N-cadherin expression and epithelial-mesenchymal transition in melasma. J Invest Dermatol. 2014; 134:2967–76. https://doi.org/10.1038/jid.2014.257 [PubMed]
- 121. Schneider DJ, Wu M, Le TT, Cho SH, Brenner MB, Blackburn MR, Agarwal SK. Cadherin-11 contributes to pulmonary fibrosis: potential role in TGF-β production and epithelial to mesenchymal transition. FASEB J. 2012; 26:503–12. https://doi.org/10.1096/fj.11-186098 [PubMed]
- 122. Jakubzig B, Baltes F, Henze S, Schlesinger M, Bendas G. Mechanisms of Matrix-Induced Chemoresistance of Breast Cancer Cells-Deciphering Novel Potential Targets for a Cell Sensitization. Cancers (Basel). 2018; 10:495. https://doi.org/10.3390/cancers10120495 [PubMed]
- 123. McCormack VA, dos Santos Silva I. Breast density and parenchymal patterns as markers of breast cancer risk: a meta-analysis. Cancer Epidemiol Biomarkers Prev. 2006; 15:1159–69. https://doi.org/10.1158/1055-9965.EPI-06-0034 [PubMed]
- 124. Boyd NF, Martin LJ, Yaffe MJ, Minkin S. Mammographic density and breast cancer risk: current understanding and future prospects. Breast Cancer Res. 2011; 13:223. https://doi.org/10.1186/bcr2942 [PubMed]
- 125. Nazari SS, Mukherjee P. An overview of mammographic density and its association with breast cancer. Breast Cancer. 2018; 25:259–67. https://doi.org/10.1007/s12282-018-0857-5 [PubMed]
- 126. Liu J, Shen JX, Wu HT, Li XL, Wen XF, Du CW, Zhang GJ. Collagen 1A1 (COL1A1) promotes metastasis of breast cancer and is a potential therapeutic target. Discov Med. 2018; 25:211–23. [PubMed]
- 127. Shi RZ, He YF, Wen J, Niu YN, Gao Y, Liu LH, Zhang XP, Wang Y, Zhang XL, Zhang HF, Chen M, Hu XL. Epithelial cell adhesion molecule promotes breast cancer resistance protein-mediated multidrug resistance in breast cancer by inducing partial epithelial-mesenchymal transition. Cell Biol Int. 2021; 45:1644–53. https://doi.org/10.1002/cbin.11598 [PubMed]
- 128. Tryndyak VP, Beland FA, Pogribny IP. E-cadherin transcriptional down-regulation by epigenetic and microRNA-200 family alterations is related to mesenchymal and drug-resistant phenotypes in human breast cancer cells. Int J Cancer. 2010; 126:2575–83. https://doi.org/10.1002/ijc.24972 [PubMed]
- 129. Burk U, Schubert J, Wellner U, Schmalhofer O, Vincan E, Spaderna S, Brabletz T. A reciprocal repression between ZEB1 and members of the miR-200 family promotes EMT and invasion in cancer cells. EMBO Rep. 2008; 9:582–9. https://doi.org/10.1038/embor.2008.74 [PubMed]
- 130. Miotto E, Sabbioni S, Veronese A, Calin GA, Gullini S, Liboni A, Gramantieri L, Bolondi L, Ferrazzi E, Gafà R, Lanza G, Negrini M. Frequent aberrant methylation of the CDH4 gene promoter in human colorectal and gastric cancer. Cancer Res. 2004; 64:8156–9. https://doi.org/10.1158/0008-5472.CAN-04-3000 [PubMed]
- 131. Li L, Ying J, Li H, Zhang Y, Shu X, Fan Y, Tan J, Cao Y, Tsao SW, Srivastava G, Chan AT, Tao Q. The human cadherin 11 is a pro-apoptotic tumor suppressor modulating cell stemness through Wnt/β-catenin signaling and silenced in common carcinomas. Oncogene. 2012; 31:3901–12. https://doi.org/10.1038/onc.2011.541 [PubMed]
- 132. Sarrió D, Rodriguez-Pinilla SM, Hardisson D, Cano A, Moreno-Bueno G, Palacios J. Epithelial-mesenchymal transition in breast cancer relates to the basal-like phenotype. Cancer Res. 2008; 68:989–97. https://doi.org/10.1158/0008-5472.CAN-07-2017 [PubMed]
- 133. Tomita K, van Bokhoven A, van Leenders GJ, Ruijter ET, Jansen CF, Bussemakers MJ, Schalken JA. Cadherin switching in human prostate cancer progression. Cancer Res. 2000; 60:3650–4. [PubMed]
- 134. Li Y, Guo Z, Chen H, Dong Z, Pan ZK, Ding H, Su SB, Huang S. HOXC8-Dependent Cadherin 11 Expression Facilitates Breast Cancer Cell Migration through Trio and Rac. Genes Cancer. 2011; 2:880–8. https://doi.org/10.1177/1947601911433129 [PubMed]
- 135. Zhao J, Li P, Feng H, Wang P, Zong Y, Ma J, Zhang Z, Chen X, Zheng M, Zhu Z, Lu A. Cadherin-12 contributes to tumorigenicity in colorectal cancer by promoting migration, invasion, adhersion and angiogenesis. J Transl Med. 2013; 11:288. https://doi.org/10.1186/1479-5876-11-288 [PubMed]
- 136. Wang M, Long K, Li E, Li L, Li B, Ci S, He L, Pan F, Hu Z, Guo Z. DNA polymerase beta modulates cancer progression via enhancing CDH13 expression by promoter demethylation. Oncogene. 2020; 39:5507–19. https://doi.org/10.1038/s41388-020-1386-1 [PubMed]
- 137. Krishnamachary B, Zagzag D, Nagasawa H, Rainey K, Okuyama H, Baek JH, Semenza GL. Hypoxia-inducible factor-1-dependent repression of E-cadherin in von Hippel-Lindau tumor suppressor-null renal cell carcinoma mediated by TCF3, ZFHX1A, and ZFHX1B. Cancer Res. 2006; 66:2725–31. https://doi.org/10.1158/0008-5472.CAN-05-3719 [PubMed]
- 138. Toyooka S, Toyooka KO, Harada K, Miyajima K, Makarla P, Sathyanarayana UG, Yin J, Sato F, Shivapurkar N, Meltzer SJ, Gazdar AF. Aberrant methylation of the CDH13 (H-cadherin) promoter region in colorectal cancers and adenomas. Cancer Res. 2002; 62:3382–6. [PubMed]
- 139. Takeuchi T, Misaki A, Sonobe H, Liang SB, Ohtsuki Y. Is T-cadherin (CDH13, H-cadherin) expression related to lung metastasis of osteosarcoma? Histopathology. 2000; 37:193–4. https://doi.org/10.1046/j.1365-2559.2000.00985-5.x [PubMed]
- 140. Calì B, Molon B, Viola A. Tuning cancer fate: the unremitting role of host immunity. Open Biol. 2017; 7:170006. https://doi.org/10.1098/rsob.170006 [PubMed]
- 141. Nawijn MC, Hackett TL, Postma DS, van Oosterhout AJ, Heijink IH. E-cadherin: gatekeeper of airway mucosa and allergic sensitization. Trends Immunol. 2011; 32:248–55. https://doi.org/10.1016/j.it.2011.03.004 [PubMed]
- 142. Jiang Y, Wan T, Chen G, Xiu F, Xia D, Zhang W, Zhou X, Cao X. DC-CLM, a cadherin-like molecule cloned from human dendritic cells, inhibits growth of breast cancer cells. J Cancer Res Clin Oncol. 2003; 129:57–64. https://doi.org/10.1007/s00432-002-0404-8 [PubMed]
- 143. Pai SG, Carneiro BA, Mota JM, Costa R, Leite CA, Barroso-Sousa R, Kaplan JB, Chae YK, Giles FJ. Wnt/beta-catenin pathway: modulating anticancer immune response. J Hematol Oncol. 2017; 10:101. https://doi.org/10.1186/s13045-017-0471-6 [PubMed]
- 144. Jang GB, Kim JY, Cho SD, Park KS, Jung JY, Lee HY, Hong IS, Nam JS. Blockade of Wnt/β-catenin signaling suppresses breast cancer metastasis by inhibiting CSC-like phenotype. Sci Rep. 2015; 5:12465. https://doi.org/10.1038/srep12465 [PubMed]
- 145. Gattinoni L, Zhong XS, Palmer DC, Ji Y, Hinrichs CS, Yu Z, Wrzesinski C, Boni A, Cassard L, Garvin LM, Paulos CM, Muranski P, Restifo NP. Wnt signaling arrests effector T cell differentiation and generates CD8+ memory stem cells. Nat Med. 2009; 15:808–13. https://doi.org/10.1038/nm.1982 [PubMed]
- 146. Iglesia MD, Parker JS, Hoadley KA, Serody JS, Perou CM, Vincent BG. Genomic Analysis of Immune Cell Infiltrates Across 11 Tumor Types. J Natl Cancer Inst. 2016; 108:djw144. https://doi.org/10.1093/jnci/djw144 [PubMed]
- 147. Meng X, Huang Z, Teng F, Xing L, Yu J. Predictive biomarkers in PD-1/PD-L1 checkpoint blockade immunotherapy. Cancer Treat Rev. 2015; 41:868–76. https://doi.org/10.1016/j.ctrv.2015.11.001 [PubMed]
- 148. French JJ, Cresswell J, Wong WK, Seymour K, Charnley RM, Kirby JA. T cell adhesion and cytolysis of pancreatic cancer cells: a role for E-cadherin in immunotherapy? Br J Cancer. 2002; 87:1034–41. https://doi.org/10.1038/sj.bjc.6600597 [PubMed]