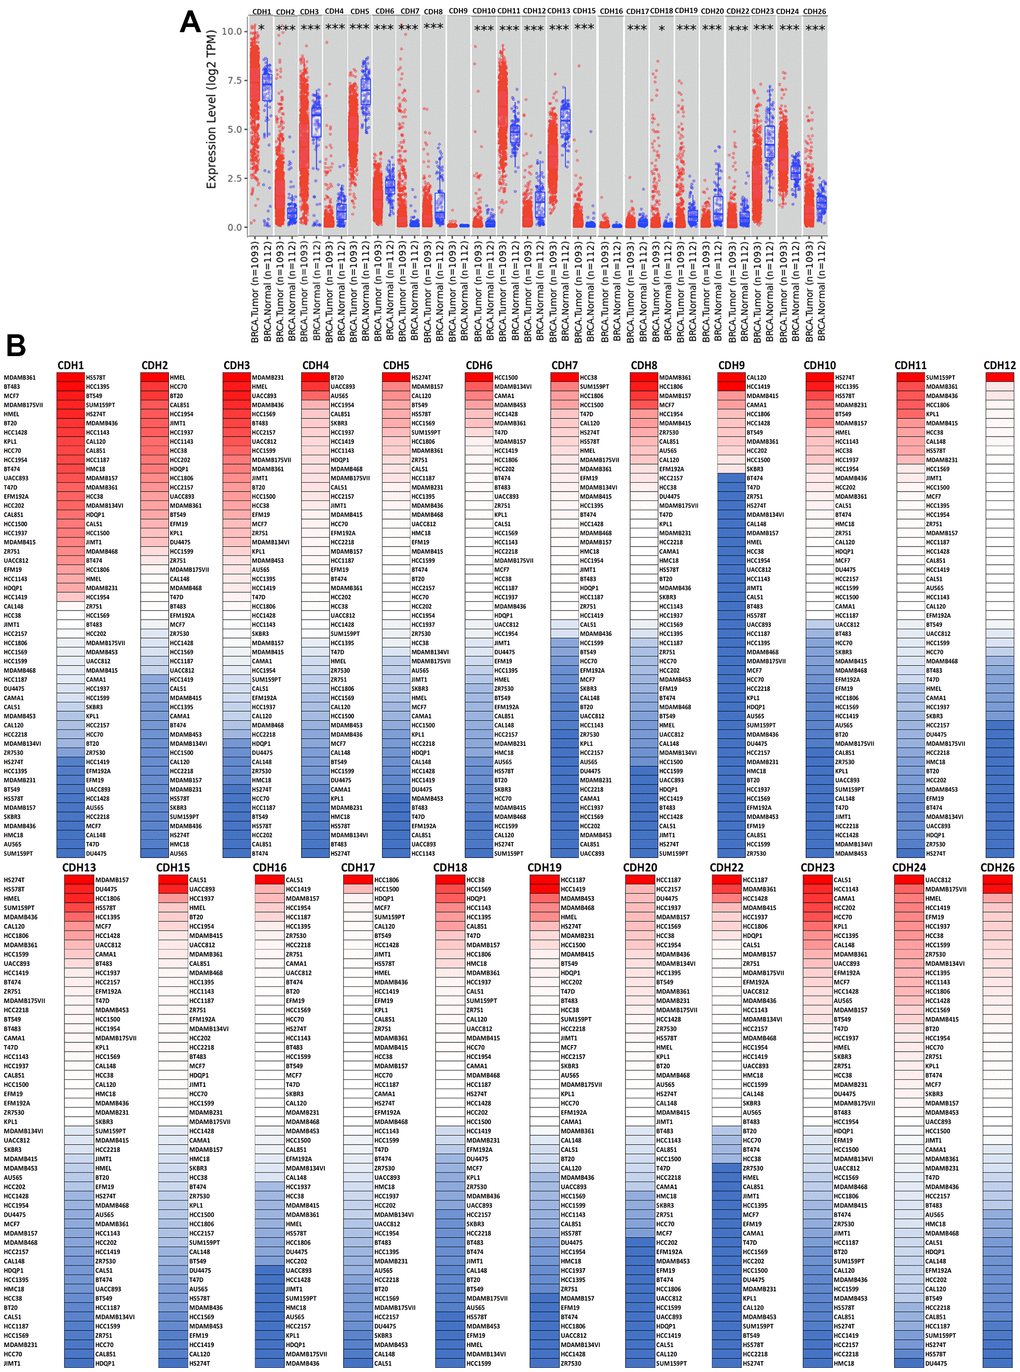
Figure 3.Expression levels of cadherin (CDH) gene family members in breast invasive carcinoma (BRCA). (A) In the TIMER database, a box plot shows transcripts of CDH gene family members in normal and breast cancer tissues. The Wilcoxon test was used to determine statistical significance; * p<0.05, *** p<0.001. (B) Expression levels of CDH gene family members in breast cancer cell lines are represented by a heatmap (CCLE). We used data from the CCLE database to generate mRNA expression values, which were then ranked. In CCLE, red denotes overexpression (top column), and blue denotes under-expression (bottom column).