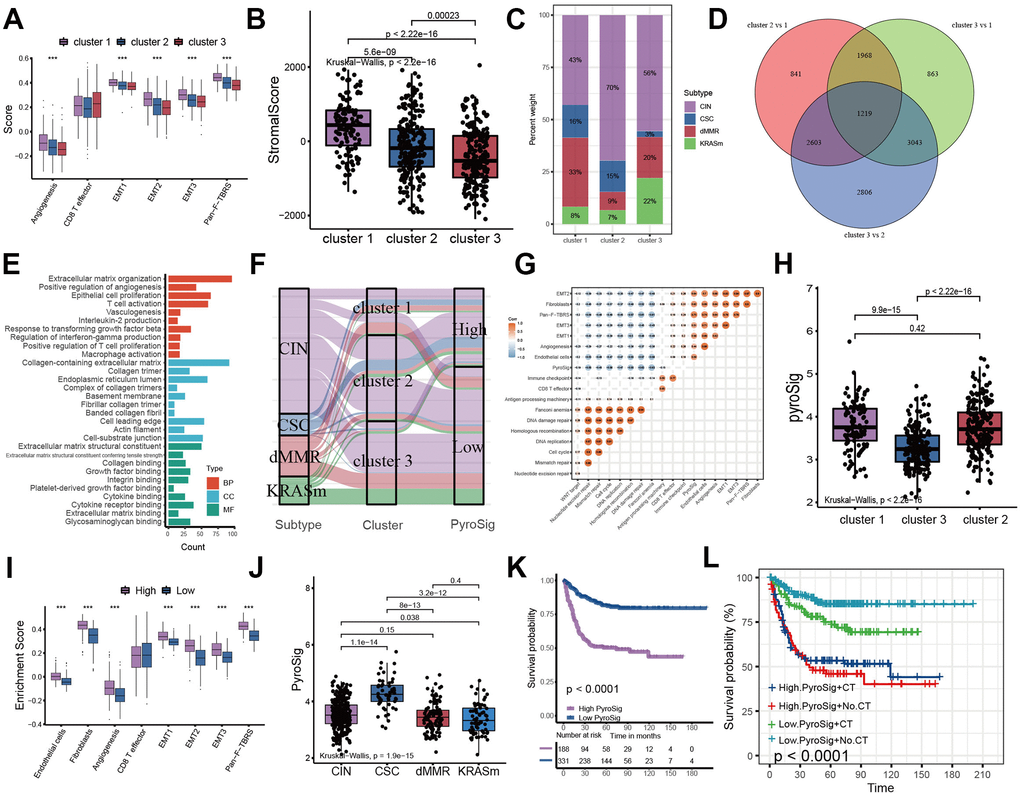
Figure 4.Construction of pyroptosis related score signature (PyroSig). (A) Variations between three distinct pyroptosis characterization clusters in pathways with stroma activation. (B) ESTIMATE algorithm analyses revealing the overall TME stromal score among three clusters. (C) The proportion of molecular subtypes in the three clusters. (D) The venn diagram showing 1219 overlap DEGs between three clusters. (E) GO functional enrichment analyses for overlap DEGs. (F) The changes of molecular subtypes, pyroptosis characterization clusters and PyroSig, visualized by alluvial diagram. (G) Spearman correlation between the known signatures and PyroSig values. (H) Differences in PyroSig signature across three distinct pyroptosis characterization clusters. (I) Difference of stromal signature between low and high PyroSig groups. (J) Differences in PyroSig across distinct molecular subtypes. (K) Kaplan-Meier curves showing the survival difference between the low and high PyroSig groups. (L) Survival analyses of four subgroups, where patients were stratified according to adjuvant chemotherapy.