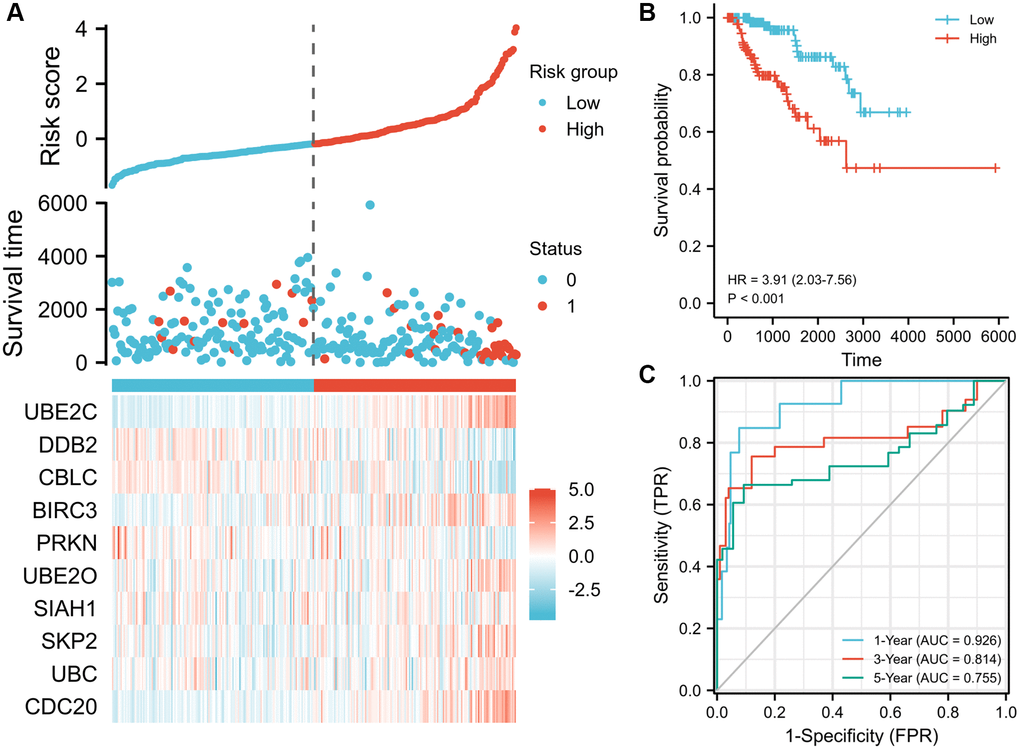
Figure 4.Prognostic risk score model analysis of risk models in OS of TCGA-PRCC cohort. (A) Scatter plots of risk score (top), scatter plot of survival time distribution (middle), and gene expression heat maps (bottom). (B) Kaplan Meier curves for overall survival between low- and high-risk score patients. (C) Time-dependent ROC curves for the prognostic model for 1-, 3-, and 5-year OS of PRCC. The AUC values represent the predictive performance of the gene signature and clinical risk factor. Abbreviations: OS: overall survival; AUC: area under the curve; HR: hazard ratio. “Red” represents the positive correlation and “Blue” represents the negative correlation.