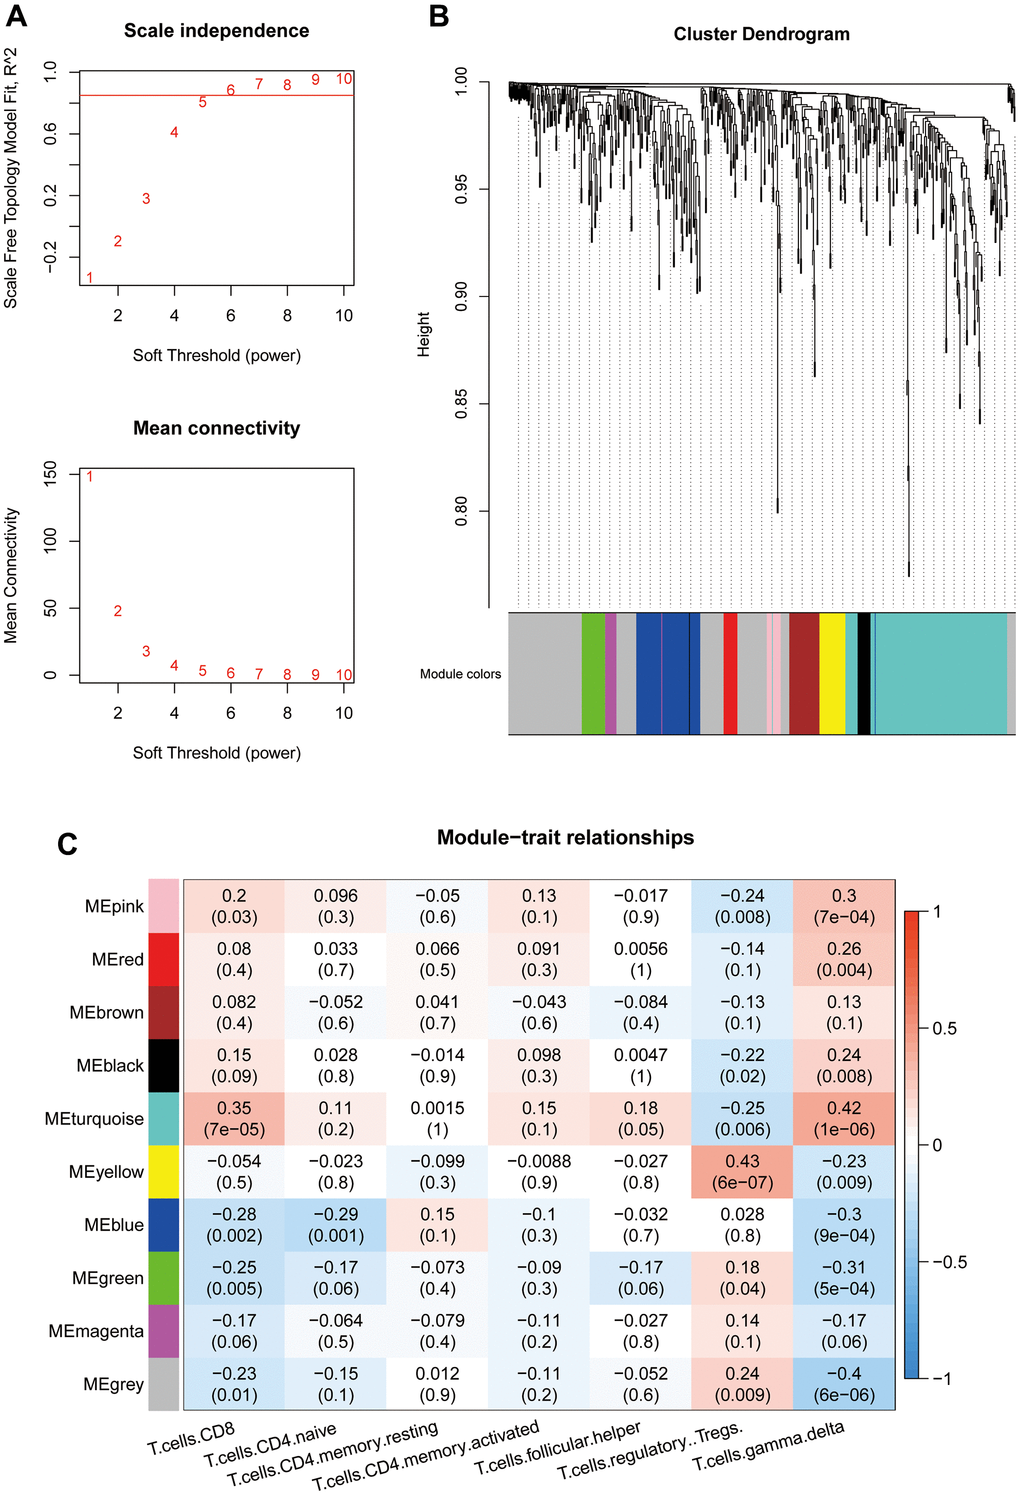
Figure 3.(A) Threshold selection for WGCNA network construction (β=6). (B) WGCNA network module classification (mergeCutHeight=0.25. The minimum module size is 10.). (C) Association between module eigenvectors and T cells. The first rows in each block are the correlation coefficients. Red indicates a positive correlation, and blue indicates a negative correlation. P values are provided in parentheses in the second row.