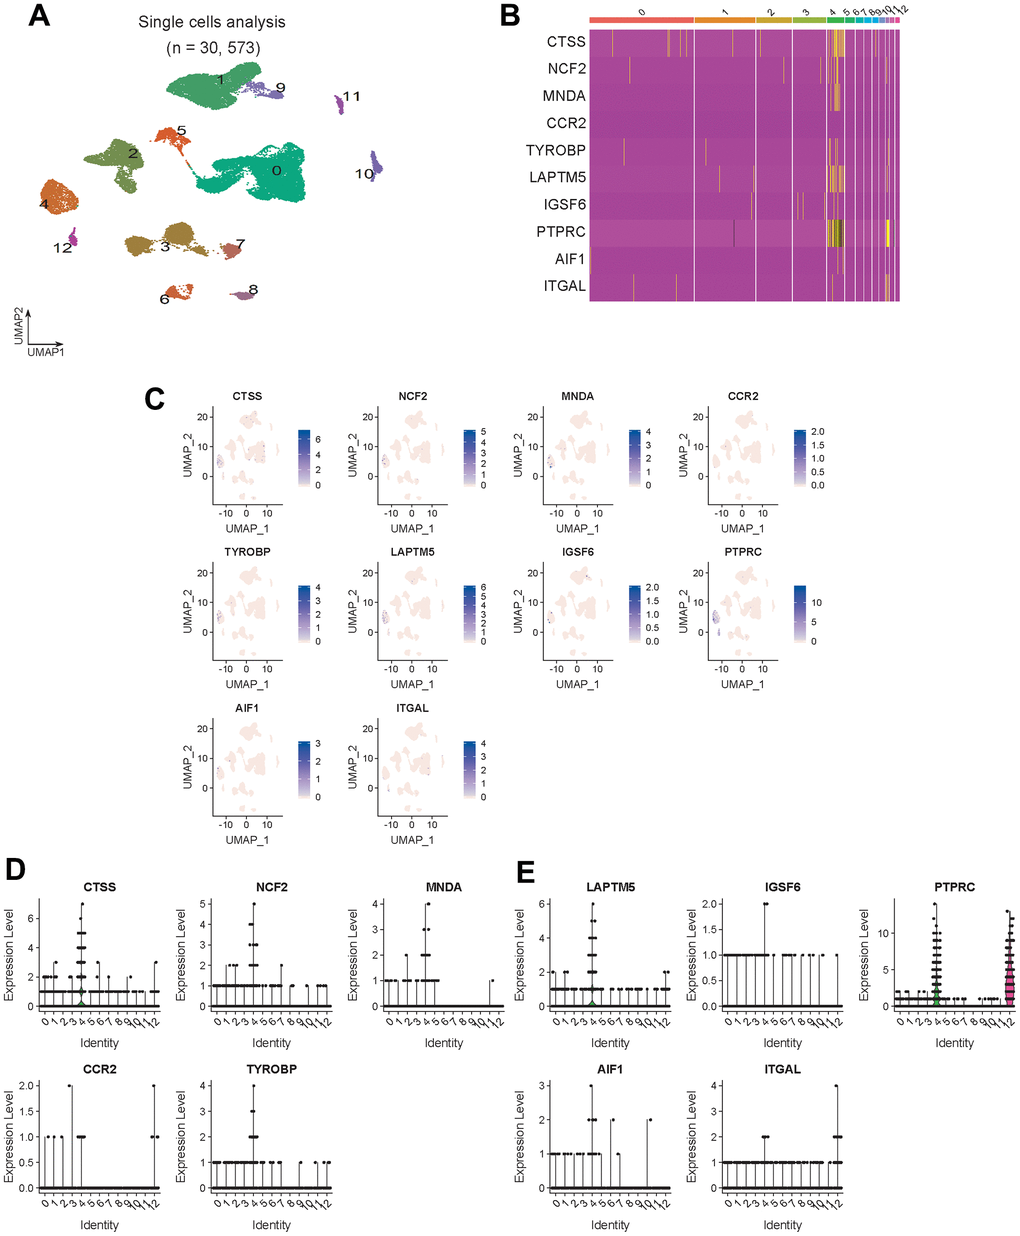
Figure 6.Hub gene expression validation. (A) Visualized cell cluster map of 30,573 single cells. (B) Heat map of 10 hub genes. (C) Expression distribution of 10 hub genes in the visual cell cluster. (D, E) Violin map of 10 hub genes showing the expression distribution of genes in different cell types.