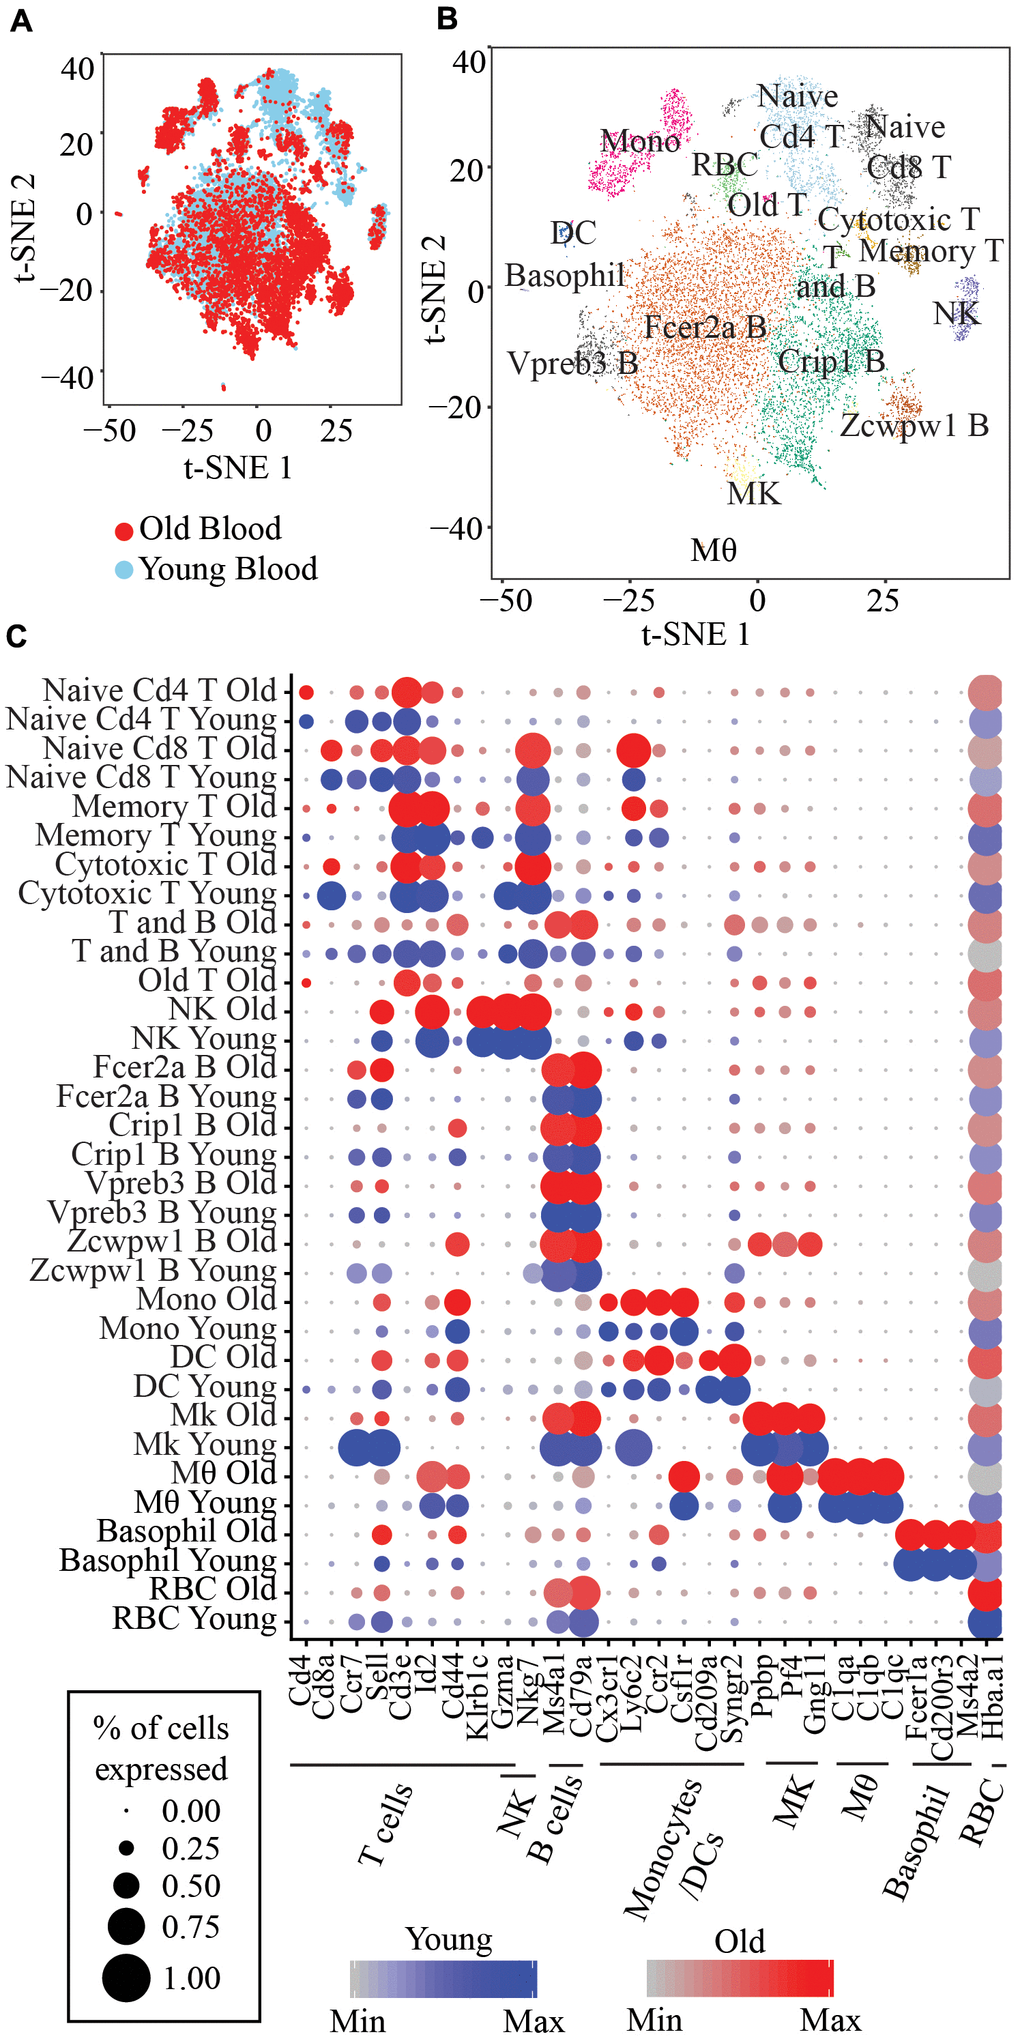
Figure 1.(A) t-SNE visualization of 14,588 old and young peripheral blood cells. (B) t-SNE visualization of the 17 clusters of peripheral blood cells. Memory T: Short-lived effector memory T cells; T and B: Proliferating T and B cells; NK: Natural killer cells; Fcer2a B: Fcer2a, Sell, Ccr7 B cells; Crip1 B: Crip1, S100a6 B cells; Vpreb3 B: Vpreb3, Spib B cells; Zcwpw1 B: Zcwpw1, S100a6 B cells; Mono: Classical monocytes; DC: Monocyte-derived DC; Mk: Megakaryocytes; Mθ: Macrophage; RBC: Red blood cells. (C) Marker genes for each immune cell type and the corresponding clusters.