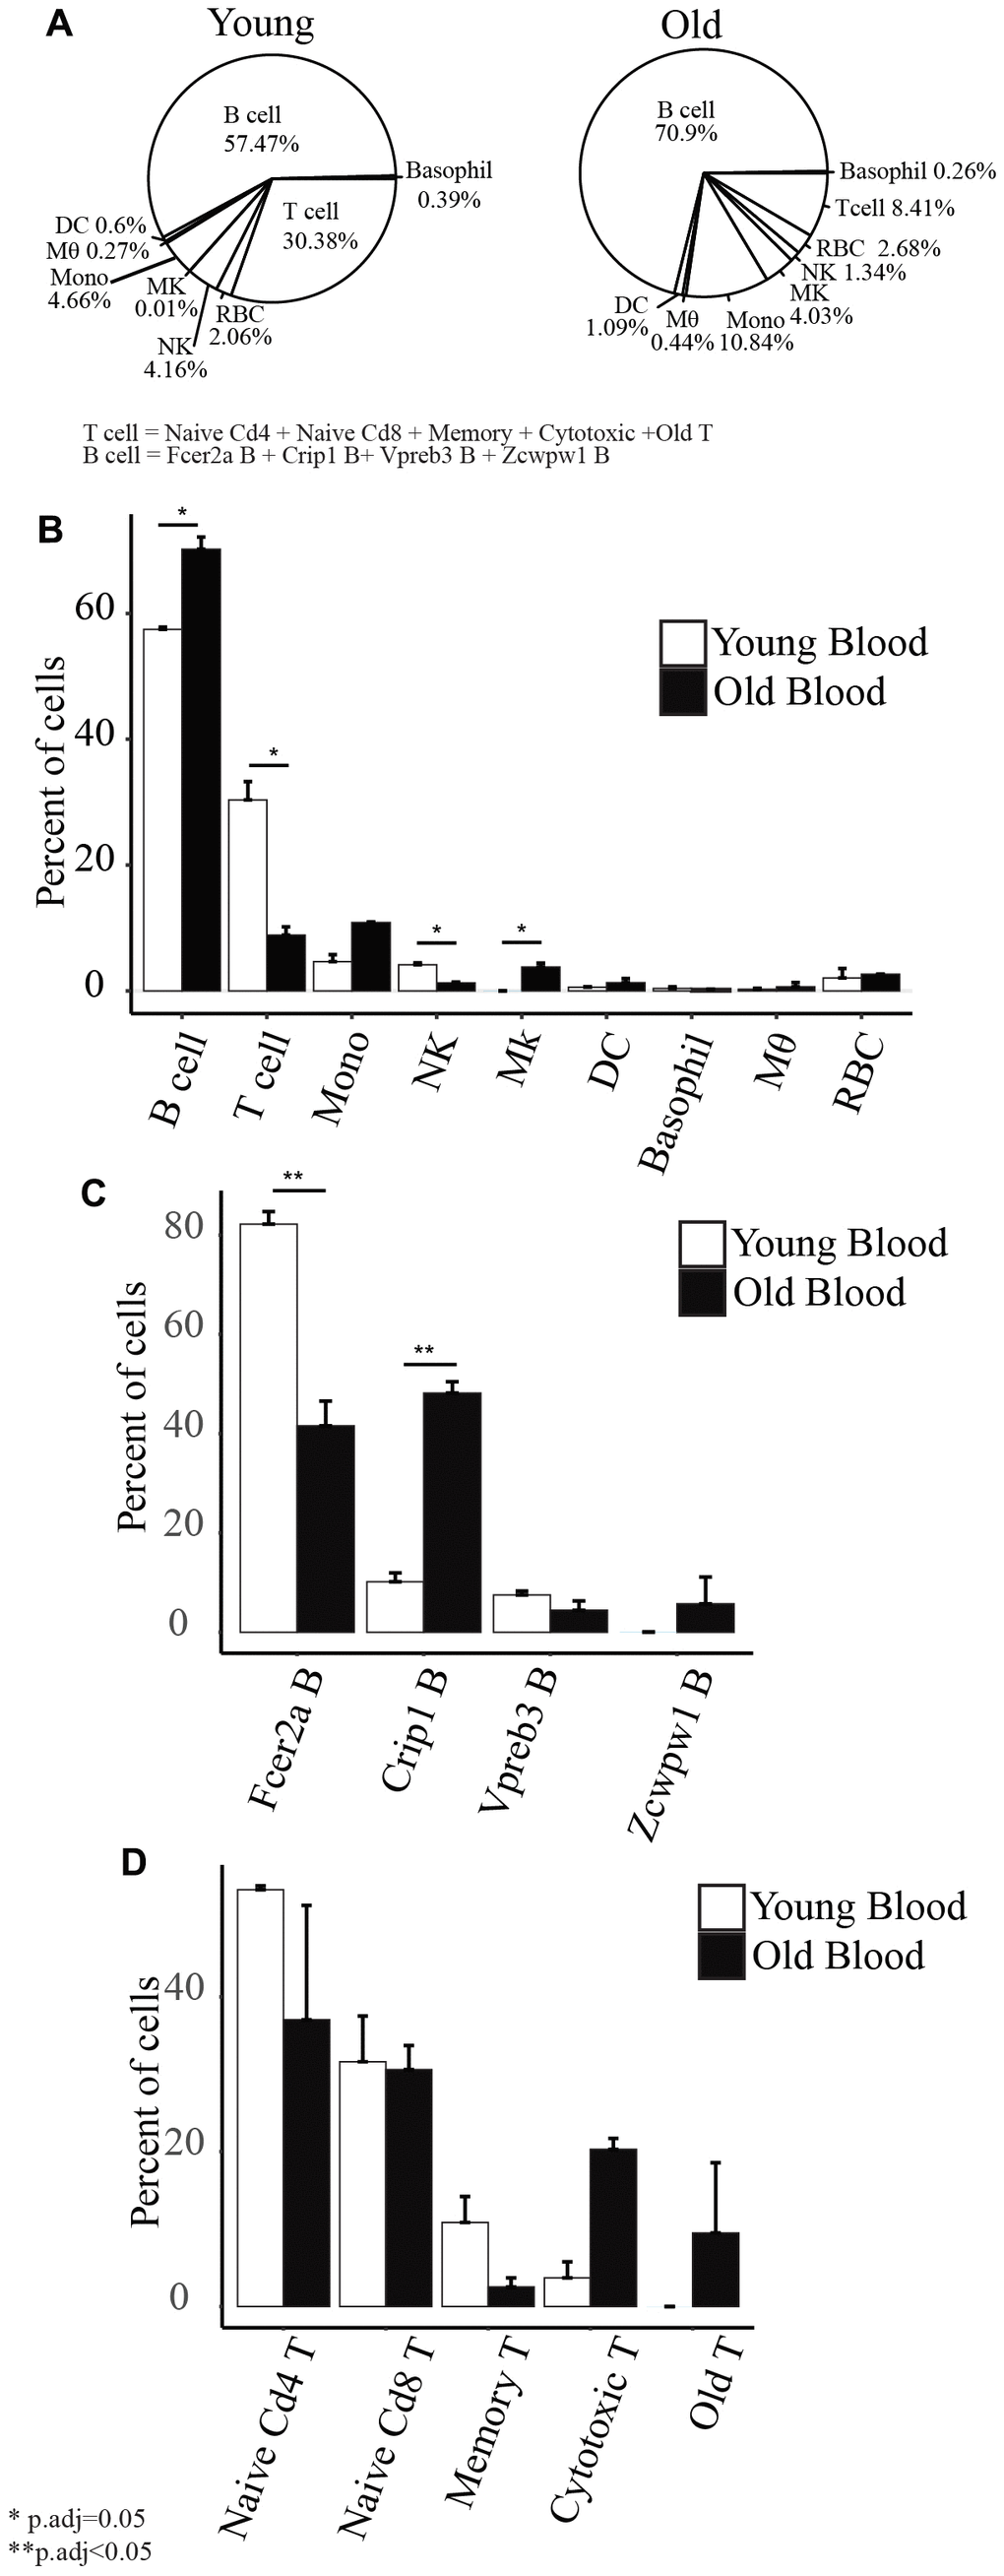
Figure 3.(A) Cell type composition of old and young peripheral blood. (B) Barplots showing the comparison of the percentage of each cell type with age. (C) Barplots showing the comparison of the subset of B cells’ percentage with age. (D) Barplots showing the comparison of the subsets of T cells’ percentage with age.